Exam 3: Quality and Performance
Exam 1: Using Operations to Create Value100 Questions
Exam 2: Process Strategy and Analysis245 Questions
Exam 3: Quality and Performance195 Questions
Exam 4: Capacity Planning108 Questions
Exam 5: Constraint Management136 Questions
Exam 6: Lean Systems164 Questions
Exam 7: Project Management140 Questions
Exam 8: Forecasting150 Questions
Exam 9: Inventory Management207 Questions
Exam 10: Operations Planning and Scheduling149 Questions
Exam 11: Resource Planning125 Questions
Exam 12: Supply Chain Design77 Questions
Exam 13: Supply Chain Logistic Networks114 Questions
Exam 14: Supply Chain Integration111 Questions
Exam 15: Supply Chain Sustainability73 Questions
Exam 16: Decision Making107 Questions
Exam 17: Waiting Lines108 Questions
Exam 18: Special Inventory Models53 Questions
Exam 19: Linear Programming86 Questions
Exam 20: Simulation54 Questions
Exam 21: Financial Analysis55 Questions
Exam 22: Acceptance Sampling Plans87 Questions
Exam 23: Measuring Output Rates106 Questions
Exam 24: Learning Curve Analysis51 Questions
Exam 25: Operations Scheduling120 Questions
Exam 26: Layout36 Questions
Select questions type
Which of the following would be a "common" cause of variation?
(Multiple Choice)
4.8/5  (35)
(35)
A metal-cutting operation has a target value of 20 and consistently averages 19.8 with a standard deviation of 0.5.The design engineers have established an upper specification limit of 22 and a lower specification limit of 18.What is the process capability index?
(Multiple Choice)
4.8/5 (36)
Since an employee's responsibility is to move production along,it is ethical to knowingly pass defective services or products to internal or external customers when capacity is tight.
(True/False)
4.7/5 (39)
Table 5.11
Factors for Calculating Three-Sigma Limits for the  Chart and R-Chart
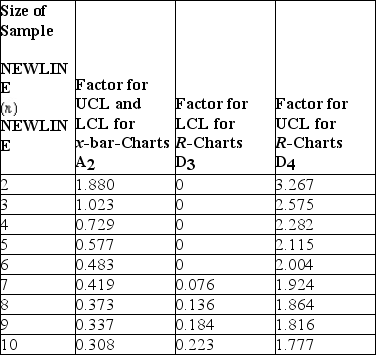 Source: 1950 ASTM Manual on Quality Control of Materials,copyright American Society for Testing Materials.Reprinted with permission.
-Thermostats are subjected to rigorous testing before they are shipped to air conditioning technicians around the world.Results from the last five samples are shown in the table.Calculate control limits for a chart that will monitor process consistency.The correct control limits as (LCL,UCL)are:
Source: 1950 ASTM Manual on Quality Control of Materials,copyright American Society for Testing Materials.Reprinted with permission.
-Thermostats are subjected to rigorous testing before they are shipped to air conditioning technicians around the world.Results from the last five samples are shown in the table.Calculate control limits for a chart that will monitor process consistency.The correct control limits as (LCL,UCL)are: 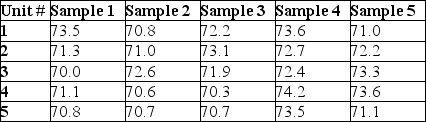
(Multiple Choice)
4.8/5 (41)
Thermostats are subjected to rigorous testing before they are shipped to air conditioning technicians around the world.Results from the last five samples are shown in the table.Is the process under control?

(Essay)
4.7/5 (43)
Table 5.4
The manager of Champion Cooling Company has recently implemented a statistical process control method.The accompanying table shows the results of five different samples of walk-in coolers that were produced in the previous month.
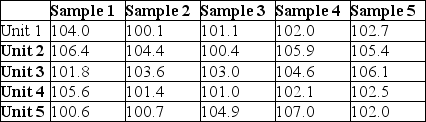 -Use the information in Table 5.4.The upper control limit for the x-bar chart with three sigma limits is:
(Multiple Choice)
4.7/5 (54)
Construct 3 control charts using the data in the table.What conclusions can you draw about the state of control for this process? 
(Multiple Choice)
4.8/5 (37)
When considering the plan-do-study-act cycle for problem solving,evaluating how closely a project's results correspond to the initial goals set for the work is part of the ________ step.
(Multiple Choice)
4.8/5 (39)
The advantage of variable measurements is that they can be quickly counted compared to attribute measurements.
(True/False)
4.7/5 (33)
At which of the following steps will the cost of detecting product defects be the highest?
(Multiple Choice)
4.8/5 (34)
Wider limits on a control chart result in lower probability of a type I error.
(True/False)
4.9/5 (35)
The ________ section of the Baldrige Performance Excellence Program has the greatest emphasis.
(Essay)
4.9/5 (37)
Filters
- Essay(0)
- Multiple Choice(0)
- Short Answer(0)
- True False(0)
- Matching(0)