Exam 3: Quality and Performance
Exam 1: Using Operations to Create Value100 Questions
Exam 2: Process Strategy and Analysis245 Questions
Exam 3: Quality and Performance195 Questions
Exam 4: Capacity Planning108 Questions
Exam 5: Constraint Management136 Questions
Exam 6: Lean Systems164 Questions
Exam 7: Project Management140 Questions
Exam 8: Forecasting150 Questions
Exam 9: Inventory Management207 Questions
Exam 10: Operations Planning and Scheduling149 Questions
Exam 11: Resource Planning125 Questions
Exam 12: Supply Chain Design77 Questions
Exam 13: Supply Chain Logistic Networks114 Questions
Exam 14: Supply Chain Integration111 Questions
Exam 15: Supply Chain Sustainability73 Questions
Exam 16: Decision Making107 Questions
Exam 17: Waiting Lines108 Questions
Exam 18: Special Inventory Models53 Questions
Exam 19: Linear Programming86 Questions
Exam 20: Simulation54 Questions
Exam 21: Financial Analysis55 Questions
Exam 22: Acceptance Sampling Plans87 Questions
Exam 23: Measuring Output Rates106 Questions
Exam 24: Learning Curve Analysis51 Questions
Exam 25: Operations Scheduling120 Questions
Exam 26: Layout36 Questions
Select questions type
What is the long-term impact of unethical business practices on product and service quality?
(Essay)
4.8/5  (33)
(33)
________ is the application of statistical techniques to determine if the quality of incoming materials should be accepted or rejected,based on the testing of a sample of parts.
(Essay)
4.8/5 (39)
Strategic planning is given the most weight among the Baldrige Performance Excellence Program.
(True/False)
4.8/5 (41)
Hassan was the company plotter.Give him any data set and he could plot a graph that was not only accurate,but also aesthetically pleasing.One afternoon he took some attribute data and plotted it as a p-chart.When Saba,his supervisor,saw the plot he insisted it be discarded and in its place a c-chart should be constructed.Hassan made the c-chart and noticed that when he placed the two charts one on top of the other,the lines created by the data points were exactly the same shape.Has our plotting colleague made a mistake? If not,why should there be these two types of charts when the data generate identical lines?
(Essay)
4.8/5 (34)
The international standard that is applied to determine a company's "environmental friendliness" is:
(Multiple Choice)
4.8/5 (38)
As he entered his broker's office for the first time,the young associate professor was dazzled by its tasteful accoutrements and the offer of a double tall split shot skinny hazelnut latte.He knew his lottery winnings would be safe here,thanks to his:
(Multiple Choice)
4.8/5 (33)
Historically,the average proportion of defective bars has been 0.015.Samples will be of 100 bars each.Construct a p-chart using z = 3.What is the value of UCL?
(Multiple Choice)
4.9/5 (41)
Table 5.4
The manager of Champion Cooling Company has recently implemented a statistical process control method.The accompanying table shows the results of five different samples of walk-in coolers that were produced in the previous month.
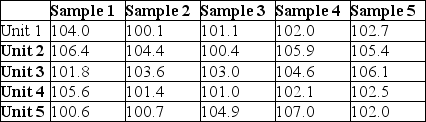 -Use the data in Table 5.4.What would be the best chart to construct to monitor how consistent the production process is?
(Multiple Choice)
4.8/5 (33)
Table 5.3
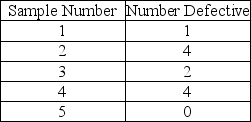 -Four samples of 100 each were taken from an assembly line,with the following results:
 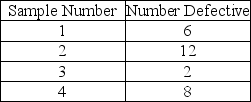 Using the historical average as the central line of the chart,which one of the following is the limit for an attributes control chart with z = 2?
(Multiple Choice)
4.8/5 (30)
MKS Inc. ,produces meter sticks that have a target length of 100 centimeters with upper and lower specification limits of 100.05 and 99.95 centimeters respectively.Their existing process produces meter sticks with an average length of 99.97 centimeters and a standard deviation of 0.015 centimeters.What is their process capability index?
(Multiple Choice)
4.8/5 (43)
Defects are caught and corrected where they were created under a(n)________ philosophy.
(Essay)
4.8/5 (44)
Which of the following would be considered a prevention cost of quality?
(Multiple Choice)
4.9/5 (39)
When is it advantageous to use sampling rather than complete inspection?
(Essay)
4.7/5 (31)
Small groups of employees and supervisors that meet to identify,analyze,and solve process and quality problems are known as ________.
(Essay)
4.7/5 (40)
The consultant suspiciously eyed the c-chart that Chickenverks used to monitor the number of broken eggs in each 100 egg carton."You know you really should be using a p-chart," the consultant commented with an air of superiority."What's the difference between a p-chart and a c-chart in this application?" the long time Chickenverks employee asked with an obvious edge to his voice."Well," the consultant replied,"the difference is:
(Multiple Choice)
4.9/5 (40)
The UCL and LCL for an  chart are 100 ounces and 95 ounces,respectively.The sample size is 5.The inspector looks at the very next unit and finds that it is 108 ounces.What can you conclude? Why?
(Essay)
4.8/5 (46)
Provide examples of the three main tenets of total quality management as applied to this operations management course.
(Essay)
4.8/5 (38)
A manufacturer embarking on a Six Sigma program sets the goal of having true Six Sigma capability for all processes by the end of the month.If their current process capability index on a key metric is less than 2.0 and the process capability ratio is 1.0,what must happen with the process standard deviation?
(Multiple Choice)
4.9/5 (38)
In Statistical Process Control,________ are used to detect defects and determine if the process has deviated from design specifications.
(Multiple Choice)
4.8/5 (35)
Filters
- Essay(0)
- Multiple Choice(0)
- Short Answer(0)
- True False(0)
- Matching(0)