Exam 15: Nonparametric Statistics
Exam 1: Describing Data With Graphs94 Questions
Exam 2: Describing Data With Numerical Measures186 Questions
Exam 3: Describing Bivariate Data35 Questions
Exam 4: Probability and Probability Distributions136 Questions
Exam 5: Several Useful Discrete Distributions129 Questions
Exam 6: The Normal Probability Distribution196 Questions
Exam 7: Sampling Distributions162 Questions
Exam 8: Large-Sample Estimation173 Questions
Exam 9: Large-Sample Tests of Hypotheses210 Questions
Exam 10: Inference From Small Samples261 Questions
Exam 11: The Analysis of Variance156 Questions
Exam 12: Linear Regression and Correlation165 Questions
Exam 13: Multiple Regression Analysis178 Questions
Exam 14: Analysis of Categorical Data136 Questions
Exam 15: Nonparametric Statistics198 Questions
Select questions type
Comparing the output of strawberries grown on plots using fertilizer A with that grown on otherwise identical plots using fertilizer B, in order to make a general assessment of relative fertilizer effectiveness, may well call for:
(Multiple Choice)
4.8/5  (48)
(48)
The Wilcoxon rank sum test (like most of the nonparametric tests presented in your book) actually tests to determine whether the population distributions have:
(Multiple Choice)
4.8/5 (29)
You are performing the Wilcoxon rank-sum test. The 10th through 12th values in an ordered array of pooled sample data all equal $100, while the 9th value is less than $100 and the 13th value is more than $100. The appropriate ranks for the three $100 values are:
(Multiple Choice)
4.8/5 (41)
A one-sample t-test is the parametric counterpart of the Wilcoxon signed rank test for matched pairs.
(True/False)
4.7/5 (34)
Two psychometricians (educators who are experts in the field of psychological test design) were asked to rank six designs for a new standardized college entrance exam. 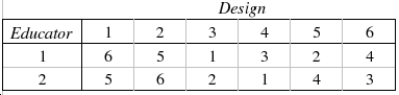 This problem uses Spearman's rank correlation coefficient to see if there is a (positive) relationship between the educators' rankings.
The null and alternate hypotheses are as follows:
This problem uses Spearman's rank correlation coefficient to see if there is a (positive) relationship between the educators' rankings.
The null and alternate hypotheses are as follows:  (There is no association between the rank pairs)
  (The correlation between the rank pairs is positive)
Describe why the test statistic
(The correlation between the rank pairs is positive)
Describe why the test statistic  is called the rank correlation coefficient.
________________________________________________________
Test Statistic:
is called the rank correlation coefficient.
________________________________________________________
Test Statistic:  = ______________
Rejection region (for
= ______________
Rejection region (for  = 0.05):
Reject
= 0.05):
Reject  if
if  > ______________
Conclude: ______________
There ______________ sufficient evidence to indicate there is any significant positive correlation between the educators' rankings.
What does this result mean in the context of the problem?
________________________________________________________
What is the observed significance level for this test?
______________
> ______________
Conclude: ______________
There ______________ sufficient evidence to indicate there is any significant positive correlation between the educators' rankings.
What does this result mean in the context of the problem?
________________________________________________________
What is the observed significance level for this test?
______________
(Essay)
4.9/5 (43)
Which one of the following statements correctly states the difference between parametric and nonparametric statistical methods?
(Multiple Choice)
4.8/5 (38)
A randomized block design analysis of variance test corresponds to:
(Multiple Choice)
4.8/5 (48)
A toy store manager was interested in determining whether the assembly time is the same for three models of baby strollers. The manager selected five employees at random and asked each of them to assemble each of the strollers. The assembly time, in minutes, was recorded as follows: 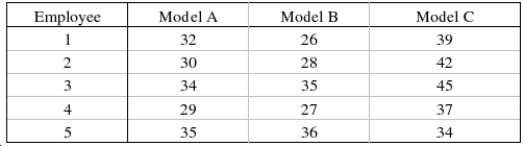 The manager wasn't sure whether the assumptions for the usual analysis of variance were valid, so she decided to use a nonparametric procedure. Use the appropriate method to determine whether the assembly time is the same for the three models of baby strollers. Use
  = 0.05.
Test Statistic:
= 0.05.
Test Statistic:  = ______________
Reject Region:
Reject
= ______________
Reject Region:
Reject  if
if  > ______________
Conclude: ______________
The distributions of assembly time for the three models of baby strollers are ______________.
> ______________
Conclude: ______________
The distributions of assembly time for the three models of baby strollers are ______________.
(Short Answer)
4.8/5 (40)
The Wilcoxon signed rank test for matched pairs is the nonparametric counterpart of the paired two-sample t-test of  .
.
(True/False)
4.9/5 (42)
Twenty students are given an attitude test before and after viewing a motion picture designed to change their attitudes favorably toward a new curriculum. A high score indicates a favorable attitude and a low score indicates an unfavorable attitude, with the scores ranging from 1 to 30. This problem will use the sign test on the data given below to see if we can conclude the motion picture was successful in improving attitudes. 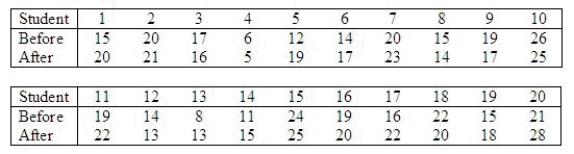 Describe what the test statistic is for the sign test.
________________________________________________________
What is the value of the test statistic in this problem?
______________
Is this a one-tailed test or a two-tailed test?
______________
Find the rejection region for
Describe what the test statistic is for the sign test.
________________________________________________________
What is the value of the test statistic in this problem?
______________
Is this a one-tailed test or a two-tailed test?
______________
Find the rejection region for  = 0.10.
Reject
= 0.10.
Reject  when T > ______________
Using
when T > ______________
Using  as above, can we conclude the motion picture was successful in changing attitudes?
______________
Conclusion: The motion picture was ______________ in changing attitudes.
At what level of significance could we reject H0?
______________
as above, can we conclude the motion picture was successful in changing attitudes?
______________
Conclusion: The motion picture was ______________ in changing attitudes.
At what level of significance could we reject H0?
______________
(Essay)
4.9/5 (32)
Which one of the following is not a reason why one might use a sign test to make a comparison between two populations?
(Multiple Choice)
4.9/5 (26)
A parametric test is a hypothesis test that depends on certain specific assumptions about the probability distribution of population values or the sizes of population parameters.
(True/False)
4.9/5 (31)
It is important to sponsors of television shows that viewers remember as much as possible about the commercials. The advertising executive of a large company is trying to decide which of two commercials to use on a weekly half-hour comedy. To help make a decision she decides to have 12 individuals watch both commercials. After each viewing, each respondent is given a quiz consisting of 10 questions. The number of correct responses is recorded and listed below. Assume that the quiz results are not normally distributed.  Do these data provide enough evidence at the 5% significance level to conclude that the two commercials differ?
z-statistic = ______________
Reject
Do these data provide enough evidence at the 5% significance level to conclude that the two commercials differ?
z-statistic = ______________
Reject  if |z| > ______________
Conclusion: ______________
The data ______________ enough evidence at the 5% significance level to conclude that the two commercials differ
if |z| > ______________
Conclusion: ______________
The data ______________ enough evidence at the 5% significance level to conclude that the two commercials differ
(Short Answer)
4.8/5 (43)
The significance level for a Wilcoxon signed rank test is 0.05. The alternative hypothesis is stated as: The location of population 1 is to the left of the location of population 2. The appropriate critical value for a sample of size 25 (that is, the number of nonzero differences is 25) is:
(Multiple Choice)
5.0/5 (40)
In a Wilcoxon signed rank test for matched pairs with n = 35, the rank sums of the positive and negative differences are 380 and 225, respectively. The value of the standardized test statistic z is:
(Multiple Choice)
4.9/5 (45)
A school principal suspected that a teacher's attitude toward a first-grader depended on his original judgment of the child's ability. The principal also suspected that much of that judgment was based on the first-grader's IQ score, which was usually known to the teacher. After three weeks of teaching, a teacher was asked to rank the nine children in his class from 1 (highest) to 9 (lowest) as to his opinion of their ability. 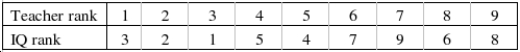 Do the data provide sufficient evidence to indicate a positive correlation between the teacher's ranks and the ranks of the IQs? Use
  = .05.
Test Statistic:
= .05.
Test Statistic:  = ______________
Reject Region:
Reject
= ______________
Reject Region:
Reject  if |
if |  | > ______________
Conclude:
______________
A positive correlation ______________ between the teacher's ranks of the IQs.
| > ______________
Conclude:
______________
A positive correlation ______________ between the teacher's ranks of the IQs.
(Short Answer)
4.9/5 (35)
In testing  at the 5% significance level, a sample of size 20 is used. The rejection region is:
(Multiple Choice)
5.0/5 (35)
The Friedman test statistic is approximately chi-squared distributed with (k - 1) degrees of freedom, provided that either the number of blocks b or the number of treatments k is greater than or equal to 5.
(True/False)
4.8/5 (32)
Filters
- Essay(0)
- Multiple Choice(0)
- Short Answer(0)
- True False(0)
- Matching(0)