Exam 15: Nonparametric Statistics
Exam 1: Describing Data With Graphs94 Questions
Exam 2: Describing Data With Numerical Measures186 Questions
Exam 3: Describing Bivariate Data35 Questions
Exam 4: Probability and Probability Distributions136 Questions
Exam 5: Several Useful Discrete Distributions129 Questions
Exam 6: The Normal Probability Distribution196 Questions
Exam 7: Sampling Distributions162 Questions
Exam 8: Large-Sample Estimation173 Questions
Exam 9: Large-Sample Tests of Hypotheses210 Questions
Exam 10: Inference From Small Samples261 Questions
Exam 11: The Analysis of Variance156 Questions
Exam 12: Linear Regression and Correlation165 Questions
Exam 13: Multiple Regression Analysis178 Questions
Exam 14: Analysis of Categorical Data136 Questions
Exam 15: Nonparametric Statistics198 Questions
Select questions type
The following statistics are drawn from two independent samples: n1 = 25, n2 = 28, T1 = 800, and T1* = 550. Test at the 5% significance level to determine whether the two population locations differ.
The null and alternate hypotheses are:  : The two population locations are the same.
  : The two population locations differ.
Test statistic = ______________
Critical Value = ______________
Conclusion: ______________
The two population locations are ______________.
: The two population locations differ.
Test statistic = ______________
Critical Value = ______________
Conclusion: ______________
The two population locations are ______________.
(Short Answer)
4.9/5  (43)
(43)
Given the statistics: n1 = 6, n2 = 9, T1 = 42, and T1* = 54, use the Wilcoxon rank sum test to determine at the 5% significance whether the location of population 1 is to the right of the location of population 2.
The null and alternate hypotheses are:  : The two population locations are the same.
  : The location of population A is to the right of the location of population B.
Test statistic = ______________
Critical Value = ______________
Conclusion: ______________
The two population locations are ______________.
: The location of population A is to the right of the location of population B.
Test statistic = ______________
Critical Value = ______________
Conclusion: ______________
The two population locations are ______________.
(Short Answer)
4.8/5 (38)
A movie critic wanted to determine whether or not moviegoers of different age groups evaluated a movie differently. With this objective, he commissioned a survey that asked people their ratings of the most recently watched movies. The rating categories were: 1 = terrible, 2 = fair, 3 = good, and 4 = excellent. Each respondent was also asked to categorize his or her age as either: 1 = teenager, 2 = young adult (20-34), 3 = middle age (35-50), and 4 = senior (over 50). The results are shown below. 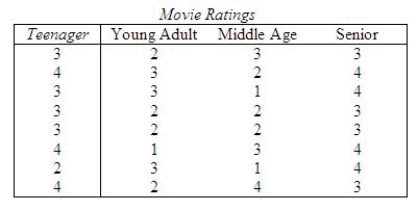 Do these data provide sufficient evidence to infer at the 5% significance level that there were differences in ratings among the different age categories?
Test statistic:
H = ______________
What is the critical value for the test statistic?
Reject
Do these data provide sufficient evidence to infer at the 5% significance level that there were differences in ratings among the different age categories?
Test statistic:
H = ______________
What is the critical value for the test statistic?
Reject  if the test statistic > ______________.
Conclude: ______________
There ______________ sufficient evidence to infer at the 5% significance level that there were differences in ratings among the different age categories.
What statement can be made about the p-value for this test?
______________
if the test statistic > ______________.
Conclude: ______________
There ______________ sufficient evidence to infer at the 5% significance level that there were differences in ratings among the different age categories.
What statement can be made about the p-value for this test?
______________
(Short Answer)
4.7/5 (35)
A nonparametric method to compare two populations, when the samples are matched pairs and the data are ordinal, is the:
(Multiple Choice)
4.8/5 (32)
The Kruskal-Wallis test can be conducted as one or two-tail test.
(True/False)
4.7/5 (34)
Apply the Kruskal-Wallis test to determine if there is enough evidence at the 5% significance level to infer that at least two populations differ. 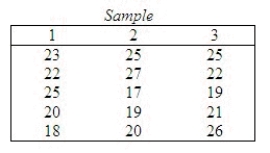 Test statistic: H = ______________
Reject
Test statistic: H = ______________
Reject  if H > ______________
Conclude: ______________
There ______________ enough evidence at the 5% significance level to infer that at least two populations differ.
if H > ______________
Conclude: ______________
There ______________ enough evidence at the 5% significance level to infer that at least two populations differ.
(Short Answer)
4.8/5 (37)
The Friedman test is the nonparametric counterpart to the randomized block design of the analysis of variance.
(True/False)
4.8/5 (39)
Consider the following two independent samples: Sample A: 15 17 18
Sample B: 14 16 19 19 20 22 23
The value of the test statistic for a right-tailed Wilcoxon rank sum test is:
(Multiple Choice)
4.8/5 (37)
Nonparametric procedures are often, and perhaps more accurately, called free-agent statistics.
(True/False)
4.8/5 (30)
Two different workbooks and two distinct teaching machines were to be evaluated on their effectiveness in teaching the concept of multiplication. A fourth grade class of 24 subjects was randomly assigned to 4 groups and each group in turn was randomly assigned to a teaching method. A test was given and the number of errors was recorded. This problem uses the Kruskal-Wallis H test to see if the number of errors differs from one teaching method to another. 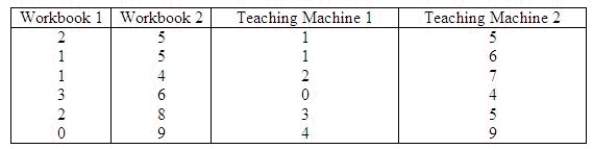 What is the value of H in this problem?
______________
Find the rejection region for
What is the value of H in this problem?
______________
Find the rejection region for  = 0.05.
Reject
= 0.05.
Reject  if H > ______________
Conclude: ______________
There is ______________ evidence at
if H > ______________
Conclude: ______________
There is ______________ evidence at  = 0.05 to say that the number of errors differs from one teaching method to another.
What is the p-value for this test?
______________
= 0.05 to say that the number of errors differs from one teaching method to another.
What is the p-value for this test?
______________
(Short Answer)
4.9/5 (40)
The nonparametric tests discussed in your book (Wilcoxon rank sum test, sign test, Wilcoxon signed rank test, Kruskal-Wallis test and Friedman test) all require that the probability distributions be:
(Multiple Choice)
4.8/5 (36)
A Wilcoxon rank sum test for comparing two independent samples involves two samples of sizes 6 and 9. The alternative hypothesis is that the location of population 1 is to the left of the location of population 2. Using a 0.05 significance level, the appropriate critical values are 31 and 65.
(True/False)
4.7/5 (34)
The Wilcoxon signed rank test statistic is approximately normally distributed whenever the sample sizes are larger than or equal to:
(Multiple Choice)
4.8/5 (36)
The Spearman rank correlation coefficient is calculated by first ranking the data values, and then calculating the Pearson correlation coefficient of the ranks.
(True/False)
4.8/5 (32)
The procedure for the Wilcoxon rank sum test requires that we rank each group separately rather than together.
(True/False)
4.7/5 (37)
A vendor was interested in determining whether two soft drink machines dispense the same amount of liquid. A sample of size seven was selected from each machine and the amount of liquid dispensed (in ounces) was recorded as 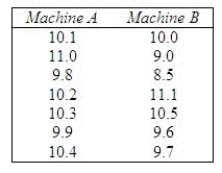 Use the Wilcoxon rank sum test to determine whether the distributions for the amount of liquid dispensed are the same for both machines. Use
  = 0.05.
The null and alternate hypotheses are:
= 0.05.
The null and alternate hypotheses are:  : The distributions for the amount of liquid dispensed are identical for the two machines.
  : The distributions for the amount of liquid dispensed differ for the two machines.
What is the test statistic?
T:______________
What is the critical value for the test statistic?
______________
Thus: ______________
Conclude:
We conclude that the distributions of the amount of liquid dispensed by the two machines are ______________.
: The distributions for the amount of liquid dispensed differ for the two machines.
What is the test statistic?
T:______________
What is the critical value for the test statistic?
______________
Thus: ______________
Conclude:
We conclude that the distributions of the amount of liquid dispensed by the two machines are ______________.
(Short Answer)
4.8/5 (37)
Use the Wilcoxon rank sum test on the data below to determine at the 10% significance level whether the two population locations differ. 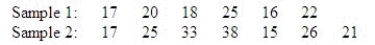 The null and alternate hypotheses are:
  : The two population locations are the same.
  : The two population locations are different.
Test statistic = ______________
Critical Value = ______________
Conclusion: ______________
There ______________ enough evidence to include conclude that the two populations are the same.
: The two population locations are different.
Test statistic = ______________
Critical Value = ______________
Conclusion: ______________
There ______________ enough evidence to include conclude that the two populations are the same.
(Short Answer)
4.8/5 (42)
Statistical methods that require, among other assumptions, that the populations be normally distributed are known as:
(Multiple Choice)
4.7/5 (35)
In a normal approximation to the sign test, the standardized test statistic is calculated as z = 2.17. If the alternative hypothesis states that the location of population 1 is to the right of the location of population 2, then the p-value of the test is 0.015.
(True/False)
4.9/5 (30)
The Kruskal-Wallis test is an extension of the Wilcoxon rank-sum test from two to more than two statistical populations.
(True/False)
4.8/5 (36)
Filters
- Essay(0)
- Multiple Choice(0)
- Short Answer(0)
- True False(0)
- Matching(0)