Exam 15: Nonparametric Statistics
Exam 1: Describing Data With Graphs94 Questions
Exam 2: Describing Data With Numerical Measures186 Questions
Exam 3: Describing Bivariate Data35 Questions
Exam 4: Probability and Probability Distributions136 Questions
Exam 5: Several Useful Discrete Distributions129 Questions
Exam 6: The Normal Probability Distribution196 Questions
Exam 7: Sampling Distributions162 Questions
Exam 8: Large-Sample Estimation173 Questions
Exam 9: Large-Sample Tests of Hypotheses210 Questions
Exam 10: Inference From Small Samples261 Questions
Exam 11: The Analysis of Variance156 Questions
Exam 12: Linear Regression and Correlation165 Questions
Exam 13: Multiple Regression Analysis178 Questions
Exam 14: Analysis of Categorical Data136 Questions
Exam 15: Nonparametric Statistics198 Questions
Select questions type
A Wilcoxon rank sum test for comparing two independent samples involves two samples of sizes 6 and 10. The alternative hypothesis is that the location of population 1 is different from the location of population 2. Using a 0.05 significance level, the appropriate critical value is 32.
(True/False)
4.8/5  (39)
(39)
Comparing the output of strawberries grown on plots using fertilizer A with that grown on otherwise identical plots using fertilizer B, in order to make a general assessment of relative fertilizer effectiveness, may well call for a:
(Multiple Choice)
4.9/5 (34)
To apply the Friedman test to determine whether the locations of two or more populations are the same, the samples must be:
(Multiple Choice)
4.8/5 (29)
The Kruskal-Wallis test can be used to test for a difference between two populations. It will produce the same outcome as the two-tail Wilcoxon rank sum test.
(True/False)
4.7/5 (28)
Which of the following correctly describes the Wilcoxon rank-sum test?
(Multiple Choice)
5.0/5 (34)
A matched pairs experiment yielded the following results:
Number of positive differences = 20,
Number of negative differences = 8
Number of zero differences = 2
Can we infer at the 5% significance level that the location of population 1 is to the right of the location of population 2?
Test statistic:
z-statistic = ______________
Rejection region:
Reject  if the z-statistic
  ______________.
Conclusion: ______________
We ______________ infer at the 5% significance level that the location of population 1 is to the right of the location of population 2.
______________.
Conclusion: ______________
We ______________ infer at the 5% significance level that the location of population 1 is to the right of the location of population 2.
(Short Answer)
4.9/5 (34)
A one-sample t-test is the parametric counterpart of the Friedman test for randomized block experimental design.
(True/False)
4.7/5 (35)
In the sign test applications, the normal approximation to the binomial distribution works very well even when the number of nonzero differences is as small as:
(Multiple Choice)
4.8/5 (44)
The Sign test or Wilcoxon Signed-Rank test are nonparametric tests that can be used to compare two dependent samples when the assumptions for a t-test are invalid.
(True/False)
4.9/5 (31)
A three independent samples one-way analysis of variance test corresponds to:
(Multiple Choice)
4.7/5 (32)
Nonparametric tests are methods of inference that make no assumptions whatsoever about the nature of underlying population distributions or their parameters.
(True/False)
4.9/5 (39)
A one-sample t-test is the parametric counterpart of the Kruskal-Wallis test.
(True/False)
5.0/5 (36)
Three treatments were compared using a completely randomized design. The data are shown in the table. 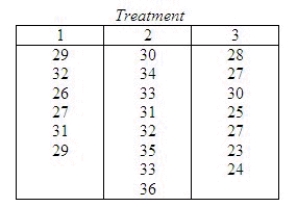 Do the data provide sufficient evidence to indicate a difference in location for at least two of the population distributions? Test using the Kruskal-Wallis H statistic with
  = 0.05.
Test statistic:
H = ______________
What is the critical value for the test statistic?
Reject
= 0.05.
Test statistic:
H = ______________
What is the critical value for the test statistic?
Reject  if the test statistic > ______________.
Conclude: ______________
There ______________ a difference in location among the three treatments.
if the test statistic > ______________.
Conclude: ______________
There ______________ a difference in location among the three treatments.
(Short Answer)
4.9/5 (35)
In a Wilcoxon rank sum test, the two sample sizes are 4 and 6, and the value of the Wilcoxon test statistic is T = 20. If the test is a two-tailed and the level of significance is  , then:
(Multiple Choice)
4.9/5 (38)
The reaction times to three stimuli were recorded for each of 8 subjects. The data, recorded in seconds, are shown below. This problem uses Friedman's  test to determine if there is a difference among the population distributions of reaction times.
 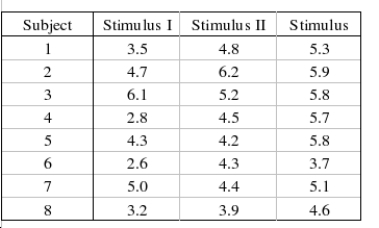 What experimental design is being used in this problem?
____________________________
The null and alternate hypotheses are as follows:
What experimental design is being used in this problem?
____________________________
The null and alternate hypotheses are as follows:  : The three population distributions are identical.
  : At least two of the three population distributions differ in location.
Describe what the Test statistic
: At least two of the three population distributions differ in location.
Describe what the Test statistic  is.
________________________________________________________
Test statistic:
is.
________________________________________________________
Test statistic:  = ______________
Rejection region for
= ______________
Rejection region for  =0.05:
Reject
=0.05:
Reject  if
if  > ______________
Conclusion: ______________
There is ______________ evidence to conclude that the reaction times for the three stimuli are different.
Estimate the p-value for this problem?
______________
> ______________
Conclusion: ______________
There is ______________ evidence to conclude that the reaction times for the three stimuli are different.
Estimate the p-value for this problem?
______________
(Essay)
4.9/5 (35)
In a normal approximation to the Wilcoxon signed rank test, the test statistic is calculated as z = 1.36. For a two-tail test, the p-value is:
(Multiple Choice)
4.8/5 (34)
Which of the following correctly describes the Wilcoxon rank-sum test?
(Multiple Choice)
4.9/5 (48)
Which of the following tests employs matched-pairs sampling?
(Multiple Choice)
4.9/5 (46)
A paired-difference experiment was conducted to compare two populations. The data are shown in the table. Use a sign test to determine whether the population distributions are different. 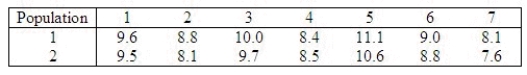 The null and alternate hypotheses are as follows:
  Determine an appropriate rejection region with
  0.01.
Critical Values: ______________ Enter n1, n2
Calculate the observed value of the test statistic.
______________
Conclude: ______________
The data present ______________ evidence to indicate that populations 1 and 2 are different.
0.01.
Critical Values: ______________ Enter n1, n2
Calculate the observed value of the test statistic.
______________
Conclude: ______________
The data present ______________ evidence to indicate that populations 1 and 2 are different.
(Short Answer)
4.9/5 (39)
Filters
- Essay(0)
- Multiple Choice(0)
- Short Answer(0)
- True False(0)
- Matching(0)