Exam 15: Nonparametric Statistics
Exam 1: Describing Data With Graphs94 Questions
Exam 2: Describing Data With Numerical Measures186 Questions
Exam 3: Describing Bivariate Data35 Questions
Exam 4: Probability and Probability Distributions136 Questions
Exam 5: Several Useful Discrete Distributions129 Questions
Exam 6: The Normal Probability Distribution196 Questions
Exam 7: Sampling Distributions162 Questions
Exam 8: Large-Sample Estimation173 Questions
Exam 9: Large-Sample Tests of Hypotheses210 Questions
Exam 10: Inference From Small Samples261 Questions
Exam 11: The Analysis of Variance156 Questions
Exam 12: Linear Regression and Correlation165 Questions
Exam 13: Multiple Regression Analysis178 Questions
Exam 14: Analysis of Categorical Data136 Questions
Exam 15: Nonparametric Statistics198 Questions
Select questions type
A nonparametric method that is equivalent to the Wilcoxon rank sum test is the:
(Multiple Choice)
4.8/5  (36)
(36)
To determine if a relationship exists between two variables, the hypotheses to be tested are 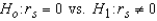 .
.
(True/False)
4.8/5 (43)
Because of the rising costs of industrial accidents, many chemical, mining, and manufacturing firms have instituted safety courses. Employees are encouraged to take these courses designed to heighten safety awareness. A company is trying to decide which one of two courses to institute. To help make a decision, eight employees take course 1 and another eight take course 2. Each employee writes a test, which is marked, out of a possible 25. The results are shown below. 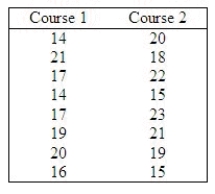 Do these data provide sufficient evidence at the 5% level of significance to conclude that the marks from course 2 are higher than those of course 1? Assume that the scores are not normally distributed.
The null and alternate hypotheses are:
Do these data provide sufficient evidence at the 5% level of significance to conclude that the marks from course 2 are higher than those of course 1? Assume that the scores are not normally distributed.
The null and alternate hypotheses are:  : The two population locations are the same.
  : The location of population 1 (course 1) is to the left of the location of population 2.
Test statistic = ______________
Critical Value = ______________
Conclusion: ______________
There ______________ enough evidence to include conclude that the two populations are the same.
: The location of population 1 (course 1) is to the left of the location of population 2.
Test statistic = ______________
Critical Value = ______________
Conclusion: ______________
There ______________ enough evidence to include conclude that the two populations are the same.
(Short Answer)
4.9/5 (32)
Suppose you want to use the Wilcoxon rank sum test to detect a shift in distribution 1 either to the left or to the right of distribution 2, based on samples of sizes  = 7 and
  = 9.
Should you use T1 or T1* as the test statistic?
______________
What is the rejection region for the test is
= 9.
Should you use T1 or T1* as the test statistic?
______________
What is the rejection region for the test is  = 0.05?
Reject
= 0.05?
Reject  if the test statistic
  ______________.
What is the rejection region for the test if
______________.
What is the rejection region for the test if  =0.01?
Reject
=0.01?
Reject  if the test statistic
  ______________.
(Short Answer)
4.9/5 (42)
The Wilcoxon rank-sum test is a nonparametric test that uses two independent simple random samples to determine whether the relative frequency distributions of two statistical populations of continuous values are identical to or different from one another.
(True/False)
4.8/5 (27)
Consider the following data set: 14, 14, 15, 16, 18, 19, 19, 20, 21, 22, 23, 25, 25, 25, 25, and 28. The rank assigned to the four observations of value 25 is:
(Multiple Choice)
4.7/5 (33)
One of the required conditions of the sign test is that the number of nonzero differences n must be greater than or equal to 30.
(True/False)
4.8/5 (37)
Nonparametric tests are often more efficient than parametric tests.
(True/False)
4.8/5 (44)
In testing the hypotheses:
H0: The two population locations are the same.
H1: The location of population 1 is to the left of the location of population 2.
The statistics n1 = 6, n2 = 8, T1 = 32, and T1* = 58 are calculated with data drawn from two independent samples.
What is the value of the test statistic?
Test statistic = ______________
What is the rejection region for this test at  = 0.05?
Critical Value = ______________
What is your conclusion at
= 0.05?
Critical Value = ______________
What is your conclusion at  = 0.05?
Conclusion: ______________
There ______________ enough evidence to include conclude that the two populations are the same.
= 0.05?
Conclusion: ______________
There ______________ enough evidence to include conclude that the two populations are the same.
(Short Answer)
4.9/5 (39)
Spearman's rank-correlation coefficient can only take on values between:
(Multiple Choice)
4.8/5 (33)
To investigate the effect of sleep on basal metabolism, seven college students who averaged seven or more hours of sleep a night (Group A), and five students who averaged less than seven hours of sleep a night (Group B), were examined and their basal metabolism recorded as shown below. 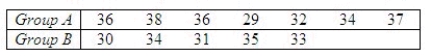 Since it was not clear whether the assumptions for a t-test were valid, the researcher decided to employ nonparametric methods. Use the Wilcoxon rank sum procedure to determine whether the metabolism measurements for Group A are significantly higher than those of Group B. Use
  = 0.05.
The null and alternate hypotheses are as follows:
= 0.05.
The null and alternate hypotheses are as follows:  : The distributions of metabolism measurements for the two groups are identical.
  : The distribution of metabolism measurements for Group B is shifted to the left of Group A. (i.e., the metabolism measurements are lower for Group B)
What is the test statistic?
: The distribution of metabolism measurements for Group B is shifted to the left of Group A. (i.e., the metabolism measurements are lower for Group B)
What is the test statistic?  : ______________
What is the critical value for the test statistic?
______________
Thus: ______________
Conclude:
We ______________ conclude the distribution of metabolism measurements for Group B is lower than those for Group A.
: ______________
What is the critical value for the test statistic?
______________
Thus: ______________
Conclude:
We ______________ conclude the distribution of metabolism measurements for Group B is lower than those for Group A.
(Short Answer)
4.8/5 (33)
The population Spearman correlation coefficient is labeled  , and the sample statistic used to estimate its value is labeled
  .
.
(True/False)
4.8/5 (35)
In a normal approximation to the sign test, the standardized test statistic is calculated as z = -1.58. To test the alternative hypothesis that the location of population 1 is to left of the location of population 2, the p-value of the test is:
(Multiple Choice)
4.8/5 (45)
The following paired observations were obtained on two variables x and y: 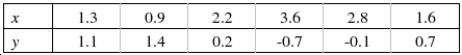 Calculate Spearman's rank correlation coefficient
  :
______________
Do the data present sufficient evidence to indicate a correlation between x and y? Test using
:
______________
Do the data present sufficient evidence to indicate a correlation between x and y? Test using  = 0.05.
Reject Region:
Reject
= 0.05.
Reject Region:
Reject  if |
if |  | > ______________
Conclude:
______________
There ______________ correlation between x and y.
| > ______________
Conclude:
______________
There ______________ correlation between x and y.
(Short Answer)
4.9/5 (48)
In a Kruskal-Wallis test, there are four samples and the value of the test statistic is calculated as H = 8.79. The most accurate statement that can be made about the p-value is that:
(Multiple Choice)
4.8/5 (43)
The z-test approximation to the Wilcoxon signed rank sum test is used whenever the number of non-zeros differences is at least 50.
(True/False)
4.9/5 (41)
Nonparametric statistical methods generally specify hypotheses in terms of population distributions rather than parameters such as means and standard deviations.
(True/False)
4.8/5 (39)
Which one of the following is a disadvantage of the sign test?
(Multiple Choice)
4.9/5 (34)
Filters
- Essay(0)
- Multiple Choice(0)
- Short Answer(0)
- True False(0)
- Matching(0)