Exam 15: Nonparametric Statistics
Exam 1: Describing Data With Graphs94 Questions
Exam 2: Describing Data With Numerical Measures186 Questions
Exam 3: Describing Bivariate Data35 Questions
Exam 4: Probability and Probability Distributions136 Questions
Exam 5: Several Useful Discrete Distributions129 Questions
Exam 6: The Normal Probability Distribution196 Questions
Exam 7: Sampling Distributions162 Questions
Exam 8: Large-Sample Estimation173 Questions
Exam 9: Large-Sample Tests of Hypotheses210 Questions
Exam 10: Inference From Small Samples261 Questions
Exam 11: The Analysis of Variance156 Questions
Exam 12: Linear Regression and Correlation165 Questions
Exam 13: Multiple Regression Analysis178 Questions
Exam 14: Analysis of Categorical Data136 Questions
Exam 15: Nonparametric Statistics198 Questions
Select questions type
In a Wilcoxon signed rank test for matched pairs with n = 32, the rank sums of the positive and negative differences are 367.5 and 160.5, respectively. The value of the standardized test statistic z is:
(Multiple Choice)
4.7/5  (38)
(38)
When assigning ranks during a Wilcoxon rank-sum test, tied values are each given the mean of the next ranks to be assigned. Which of the following statements about this averaging procedure is false?
(Multiple Choice)
4.7/5 (39)
We can use the Friedman test to determine whether a difference exists between two populations. However, if we want to determine whether one population location is larger than another, we must use the sign test.
(True/False)
4.7/5 (27)
The Wilcoxon rank sum test is a nonparametric test that measures the degree of association between two variables for which only rank-order data are available.
(True/False)
4.8/5 (38)
A supermarket chain has its own house brand of ice cream. The general manager claims that her ice cream is better than the ice cream sold by a well-known ice cream parlor chain. To test the claim 40 individuals are randomly selected to participate in the following experiment. Each respondent is given the two brands of ice cream to taste (without any identification) and asked to judge which one is better. Suppose that 25 people judge the ice cream parlor brand better, four say that the brands taste the same, and the rest claim that the supermarket brand is better. Can we conclude at the 1% significance level that the general managers' claim is false?
Test statistic:
z-statistic = ______________
Rejection region:
Reject  if the z-statistic
  ______________.
Conclusion: ______________
We ______________ conclude at the 1% significance level that the general managers' claim is false.
What is the p-value for the above test?
______________
______________.
Conclusion: ______________
We ______________ conclude at the 1% significance level that the general managers' claim is false.
What is the p-value for the above test?
______________
(Short Answer)
4.9/5 (37)
The Kruskal-Wallis test is applied to compare two or more populations, when the samples are independent and the data are either ordinal or interval but not normal.
(True/False)
4.8/5 (35)
In a Friedman test for comparing three populations, provided that there are five blocks, the test statistic is calculated as  = 6.594. Then, the most accurate statement that can be made about the p-value is that:
(Multiple Choice)
4.8/5 (37)
The Wilcoxon rank sum test statistic T is approximately normally distributed whenever the sample sizes are larger than or equal to:
(Multiple Choice)
4.9/5 (45)
The following data were generated from a blocked experiment. Conduct a Friedman test at the 5% significance level to determine if at least two population locations differ. 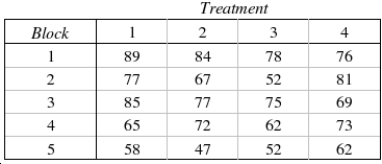 Test Statistic:
  = ______________
Reject Region:
Reject
= ______________
Reject Region:
Reject  if
if  > ______________
Conclude: ______________
The locations of all four populations are ______________.
> ______________
Conclude: ______________
The locations of all four populations are ______________.
(Short Answer)
5.0/5 (31)
Ten secretaries were selected at random from among the secretaries of a large university. The typing speed (number of words per minute) was recorded for each secretary on two different brands of computer keyboards. Assume that the typing speeds are not normally distributed. The following results were obtained. 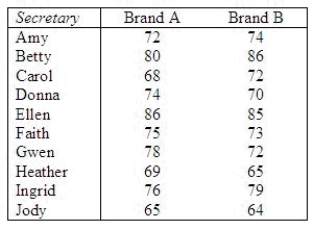 Test to determine if these data provide enough evidence at the 5% significance level to infer that the brands differ with respect to typing speed.
z-statistic = ______________
Reject
Test to determine if these data provide enough evidence at the 5% significance level to infer that the brands differ with respect to typing speed.
z-statistic = ______________
Reject  if |z| > ______________
Conclusion: ______________
These data ______________ enough evidence at the 5% significance level to infer that the brands differ with respect to typing speed.
if |z| > ______________
Conclusion: ______________
These data ______________ enough evidence at the 5% significance level to infer that the brands differ with respect to typing speed.
(Short Answer)
4.8/5 (30)
The Spearman rank-correlation test is a nonparametric test that uses the directions of differences observed in a matched-pairs sample to determine whether the relative frequency distributions of two statistical populations are identical to or different from one another.
(True/False)
4.9/5 (39)
The critical value is taken from the F-distribution whenever the Wilcoxon signed rank test is employed.
(True/False)
4.7/5 (29)
A nonparametric method to compare two populations, when the samples are matched pairs and the data are interval, and where the normality requirement necessary to perform the parametric test is unsatisfied, is the:
(Multiple Choice)
4.9/5 (34)
In testing the hypotheses:
H0: The two population locations are the same.
H1: The two population locations are different.
The statistics n1 = 5, n2 = 9, T1 = 22, and T1* = 53 are calculated with data drawn from two independent samples.
What is the value of the test statistic?
Test statistic = ______________
What is the rejection region for this test at  = 0.05?
Critical Value = ______________
What is your conclusion at
= 0.05?
Critical Value = ______________
What is your conclusion at  = 0.05?
Conclusion: ______________
The two population locations are ______________.
= 0.05?
Conclusion: ______________
The two population locations are ______________.
(Short Answer)
4.9/5 (32)
A dog kennel manager was interested in determining whether there is a difference in the time it takes a dog to complete an obstacle course for two different courses. A random sample of 36 dogs was selected and the time it took each dog to complete each course was recorded. In twelve cases it took the dog longer to complete course #1. Use the normal approximation to the sign test to determine if there is a significant difference in the time it takes to complete the two obstacle courses. Use  = 0.05.
The null and alternate hypotheses are:
= 0.05.
The null and alternate hypotheses are:  : The distributions of completion time for an obstacle course are identical for the two different courses, and p = 0.50.
  : The distributions of completion time for an obstacle course are not identical for the two different courses, and p
  0.50.
What is the z-statistic?
______________
What is the critical value for the test statistic?
Reject
0.50.
What is the z-statistic?
______________
What is the critical value for the test statistic?
Reject  if |z| > ______________
______________
Conclude that the distributions of completion time for an obstacle course are ______________ for the two different courses.
if |z| > ______________
______________
Conclude that the distributions of completion time for an obstacle course are ______________ for the two different courses.
(Short Answer)
4.9/5 (37)
Suppose you wish to detect a difference in the locations of two population distributions based on a paired-difference experiment consisting of n = 35 pairs. Use the Wilcoxon Signed-Rank test. [NOTE: ![Suppose you wish to detect a difference in the locations of two population distributions based on a paired-difference experiment consisting of n = 35 pairs. Use the Wilcoxon Signed-Rank test. [NOTE: = n(n+ 1) / 2.] If = 339, what are your conclusions? Give the test statistic. T = ______________ Give the rejection region for the test for = 0.05. Reject if T ______________. Conclude: ______________ There is ______________ of a difference between the two distributions. Conduct the test using the large-sample z-test. Compute the z-statistic: ______________ Reject if the z-statistic ______________. Conclude: ______________ There is ______________ of a difference between the two distributions. Compare your results with the nonparametric test results above. ______________](https://storage.examlex.com/TB8220/11eb6b9e_05d4_a9bb_8d9d_a58f5f909bc1_TB8220_11.jpg) = n(n+ 1) / 2.]
If
= n(n+ 1) / 2.]
If ![Suppose you wish to detect a difference in the locations of two population distributions based on a paired-difference experiment consisting of n = 35 pairs. Use the Wilcoxon Signed-Rank test. [NOTE: = n(n+ 1) / 2.] If = 339, what are your conclusions? Give the test statistic. T = ______________ Give the rejection region for the test for = 0.05. Reject if T ______________. Conclude: ______________ There is ______________ of a difference between the two distributions. Conduct the test using the large-sample z-test. Compute the z-statistic: ______________ Reject if the z-statistic ______________. Conclude: ______________ There is ______________ of a difference between the two distributions. Compare your results with the nonparametric test results above. ______________](https://storage.examlex.com/TB8220/11eb6b9e_05d4_a9bc_8d9d_f722347ab6d3_TB8220_11.jpg) = 339, what are your conclusions?
Give the test statistic.
T = ______________
Give the rejection region for the test for
= 339, what are your conclusions?
Give the test statistic.
T = ______________
Give the rejection region for the test for ![Suppose you wish to detect a difference in the locations of two population distributions based on a paired-difference experiment consisting of n = 35 pairs. Use the Wilcoxon Signed-Rank test. [NOTE: = n(n+ 1) / 2.] If = 339, what are your conclusions? Give the test statistic. T = ______________ Give the rejection region for the test for = 0.05. Reject if T ______________. Conclude: ______________ There is ______________ of a difference between the two distributions. Conduct the test using the large-sample z-test. Compute the z-statistic: ______________ Reject if the z-statistic ______________. Conclude: ______________ There is ______________ of a difference between the two distributions. Compare your results with the nonparametric test results above. ______________](https://storage.examlex.com/TB8220/11eb6b9e_05d4_d0cd_8d9d_0515ae6716cd_TB8220_11.jpg) = 0.05.
Reject
= 0.05.
Reject ![Suppose you wish to detect a difference in the locations of two population distributions based on a paired-difference experiment consisting of n = 35 pairs. Use the Wilcoxon Signed-Rank test. [NOTE: = n(n+ 1) / 2.] If = 339, what are your conclusions? Give the test statistic. T = ______________ Give the rejection region for the test for = 0.05. Reject if T ______________. Conclude: ______________ There is ______________ of a difference between the two distributions. Conduct the test using the large-sample z-test. Compute the z-statistic: ______________ Reject if the z-statistic ______________. Conclude: ______________ There is ______________ of a difference between the two distributions. Compare your results with the nonparametric test results above. ______________](https://storage.examlex.com/TB8220/11eb6b9e_05d4_d0ce_8d9d_8b72b2387727_TB8220_11.jpg) if T
if T ![Suppose you wish to detect a difference in the locations of two population distributions based on a paired-difference experiment consisting of n = 35 pairs. Use the Wilcoxon Signed-Rank test. [NOTE: = n(n+ 1) / 2.] If = 339, what are your conclusions? Give the test statistic. T = ______________ Give the rejection region for the test for = 0.05. Reject if T ______________. Conclude: ______________ There is ______________ of a difference between the two distributions. Conduct the test using the large-sample z-test. Compute the z-statistic: ______________ Reject if the z-statistic ______________. Conclude: ______________ There is ______________ of a difference between the two distributions. Compare your results with the nonparametric test results above. ______________](https://storage.examlex.com/TB8220/11eb6b9e_05d4_d0cf_8d9d_1ba065e2386c_TB8220_11.jpg) ______________.
Conclude: ______________
There is ______________ of a difference between the two distributions.
Conduct the test using the large-sample z-test.
Compute the z-statistic: ______________
Reject
______________.
Conclude: ______________
There is ______________ of a difference between the two distributions.
Conduct the test using the large-sample z-test.
Compute the z-statistic: ______________
Reject ![Suppose you wish to detect a difference in the locations of two population distributions based on a paired-difference experiment consisting of n = 35 pairs. Use the Wilcoxon Signed-Rank test. [NOTE: = n(n+ 1) / 2.] If = 339, what are your conclusions? Give the test statistic. T = ______________ Give the rejection region for the test for = 0.05. Reject if T ______________. Conclude: ______________ There is ______________ of a difference between the two distributions. Conduct the test using the large-sample z-test. Compute the z-statistic: ______________ Reject if the z-statistic ______________. Conclude: ______________ There is ______________ of a difference between the two distributions. Compare your results with the nonparametric test results above. ______________](https://storage.examlex.com/TB8220/11eb6b9e_05d4_f7e0_8d9d_77aab7234075_TB8220_11.jpg) if the z-statistic
if the z-statistic ![Suppose you wish to detect a difference in the locations of two population distributions based on a paired-difference experiment consisting of n = 35 pairs. Use the Wilcoxon Signed-Rank test. [NOTE: = n(n+ 1) / 2.] If = 339, what are your conclusions? Give the test statistic. T = ______________ Give the rejection region for the test for = 0.05. Reject if T ______________. Conclude: ______________ There is ______________ of a difference between the two distributions. Conduct the test using the large-sample z-test. Compute the z-statistic: ______________ Reject if the z-statistic ______________. Conclude: ______________ There is ______________ of a difference between the two distributions. Compare your results with the nonparametric test results above. ______________](https://storage.examlex.com/TB8220/11eb6b9e_05d4_f7e1_8d9d_aba79b2b0792_TB8220_11.jpg) ______________.
Conclude: ______________
There is ______________ of a difference between the two distributions.
Compare your results with the nonparametric test results above.
______________
______________.
Conclude: ______________
There is ______________ of a difference between the two distributions.
Compare your results with the nonparametric test results above.
______________
(Short Answer)
4.9/5 (37)
In a Kruskal-Wallis test, there are five samples, and the value of the test statistic is calculated as H = 12.32. Then the most accurate statement that can be made about the p-value of the test is that it is greater than 0.025 but smaller than 0.05.
(True/False)
4.8/5 (34)
A Wilcoxon rank sum test for comparing two populations involves two independent samples of sizes 15 and 20. If the value of un-standardized test statistic is T = 225, then the value of the standardized test statistic is z = -1.50.
(True/False)
4.7/5 (43)
A professor was interested in the relationship between a student's rank on an oral exam and the student's rank on a written exam. The professor selected 8 students at random and ranked their scores for both the oral exam and the written exam. The following data was recorded: 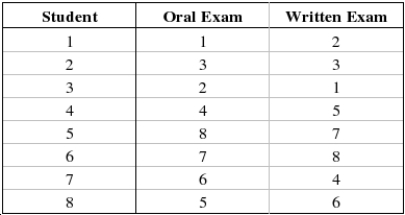 Find and interpret the rank correlation between a student's rank on the oral exam and the student's rank on the written exam.
Compute
Find and interpret the rank correlation between a student's rank on the oral exam and the student's rank on the written exam.
Compute  : ______________
There is ______________ relationship between the student's rank on the oral exam and the student's rank on the written exam.
: ______________
There is ______________ relationship between the student's rank on the oral exam and the student's rank on the written exam.
(Short Answer)
4.9/5 (37)
Filters
- Essay(0)
- Multiple Choice(0)
- Short Answer(0)
- True False(0)
- Matching(0)