Exam 15: Nonparametric Statistics
Exam 1: Describing Data With Graphs94 Questions
Exam 2: Describing Data With Numerical Measures186 Questions
Exam 3: Describing Bivariate Data35 Questions
Exam 4: Probability and Probability Distributions136 Questions
Exam 5: Several Useful Discrete Distributions129 Questions
Exam 6: The Normal Probability Distribution196 Questions
Exam 7: Sampling Distributions162 Questions
Exam 8: Large-Sample Estimation173 Questions
Exam 9: Large-Sample Tests of Hypotheses210 Questions
Exam 10: Inference From Small Samples261 Questions
Exam 11: The Analysis of Variance156 Questions
Exam 12: Linear Regression and Correlation165 Questions
Exam 13: Multiple Regression Analysis178 Questions
Exam 14: Analysis of Categorical Data136 Questions
Exam 15: Nonparametric Statistics198 Questions
Select questions type
The significance level for a Wilcoxon signed rank sum test is 0.05. The alternative hypothesis is stated as: The location of population 1 is different from the location of population 2. The appropriate critical value for a sample of size 20 (that is the number of nonzero differences is 20) is:
(Multiple Choice)
4.8/5  (43)
(43)
A computer laboratory manager was interested in whether there was a difference in functioning time before needing to be recharged for three battery packs for laptop computers. The manager took a random sample of six battery packs of each brand and tested them. The results, in hours of functioning before needing to be recharged, were recorded as 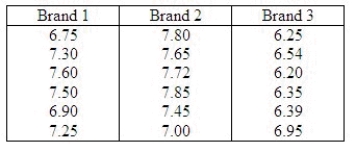 The manager, unsure that the assumptions for the usual parametric analysis of variance were valid, decided to employ nonparametric methods. Use the appropriate nonparametric procedure to determine whether the distribution of functioning time before needing to be recharged is the same for the three brands of battery packs. Use
  = 0.05.
Test Statistic:
H = ______________
What is the critical value for the test statistic?
Reject
= 0.05.
Test Statistic:
H = ______________
What is the critical value for the test statistic?
Reject  if the test statistic > ______________.
Conclude: ______________
There ______________ sufficient evidence at
if the test statistic > ______________.
Conclude: ______________
There ______________ sufficient evidence at  = 0.05 to say that at least two of the distributions of functioning times before battery needing to be recharged differ in location.
(Short Answer)
4.8/5 (39)
The Kruskal-Wallis test statistic can be approximated by a chi-squared distribution with k - 1 degrees of freedom (where k is the number of populations) whenever the sample sizes are all greater than or equal to:
(Multiple Choice)
4.8/5 (27)
Given the statistics: T+ = 520, T- = 700, and n = 50 from a matched pairs experiment, perform the Wilcoxon signed rank test to determine whether we can infer at the 5% significance level that the two population locations differ.
Test statistic:
z-statistic = ______________
Rejection region:
Reject  if |z| > ______________
Conclusion: ______________
We ______________ infer at the 5% significance level that the two population locations differ.
if |z| > ______________
Conclusion: ______________
We ______________ infer at the 5% significance level that the two population locations differ.
(Short Answer)
4.8/5 (30)
The Wilcoxon signed rank test is applied to compare two populations, when the samples are matched pairs and the data are interval but not normally distributed.
(True/False)
4.9/5 (35)
The Mann-Whitney U test is a nonparametric test that measures the degree of association between two variables for which only rank-order data are available.
(True/False)
4.9/5 (49)
In a Kruskal-Wallis test to determine whether differences exist among three different advertisements, the following statistics were obtained: 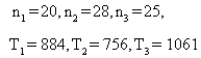 Conduct the test at the 5% significance level.
Test statistic: H = ______________
Reject
Conduct the test at the 5% significance level.
Test statistic: H = ______________
Reject  if H > ______________
Conclude: ______________
There ______________ enough evidence to conclude that differences exist among three different advertisements.
What is the most accurate statement that can be made about the p-value of this test?
______________
if H > ______________
Conclude: ______________
There ______________ enough evidence to conclude that differences exist among three different advertisements.
What is the most accurate statement that can be made about the p-value of this test?
______________
(Short Answer)
4.8/5 (37)
In testing the hypotheses  : The two population locations are the same.
  : The location of population A is to the right of the location of population B.
The statistics T+ = 271, T- = 107, and n = 27 are calculated with data drawn from a matched pairs experiment.
Test statistic:
z-statistic = ______________
p-value = ______________
Conclusion: ______________
We ______________ infer at the 1% significance level that the location of population A is to the right of the location of population B.
: The location of population A is to the right of the location of population B.
The statistics T+ = 271, T- = 107, and n = 27 are calculated with data drawn from a matched pairs experiment.
Test statistic:
z-statistic = ______________
p-value = ______________
Conclusion: ______________
We ______________ infer at the 1% significance level that the location of population A is to the right of the location of population B.
(Short Answer)
4.8/5 (38)
In a normal approximation to the Wilcoxon rank sum test, the standardized test statistic is calculated as z = 1.96. For a two-tail test, the p-value of the test is 0.025.
(True/False)
4.9/5 (40)
The Friedman test is the nonparametric counterpart of the randomized block experimental design of the analysis of variance.
(True/False)
4.8/5 (39)
The Wilcoxon Signed-Rank test may be more appropriate than the paired-difference t-test if:
(Multiple Choice)
4.9/5 (36)
Nonparametric tests can be appropriate for quantitative data when:
(Multiple Choice)
4.8/5 (35)
A nonparametric method to compare two populations, when the samples are independent and where the normality requirement necessary to perform the parametric test is not satisfied, is the:
(Multiple Choice)
4.8/5 (38)
Statistical tests that are not very sensitive to errors in assumptions are called parametric tests.
(True/False)
4.9/5 (43)
In all applications of the Kruskal-Wallis test, the alternative hypothesis to be tested is always stated as:
(Multiple Choice)
4.9/5 (41)
The Friedman test is a nonparametric test that can be used to compare more than two dependent samples when the assumptions for an analysis of variance are invalid.
(True/False)
4.9/5 (39)
Suppose you want to use the Wilcoxon rank sum test to detect a shift in distribution 1 to the right of distribution 2, based on samples of sizes  = 7 and
  = 9.
Should you use T1 or T1* as the test statistic?
______________
What is the rejection region for the test if
= 9.
Should you use T1 or T1* as the test statistic?
______________
What is the rejection region for the test if  = 0.05?
Reject
= 0.05?
Reject  if the test statistic
  ______________.
What is the rejection region for the test if
______________.
What is the rejection region for the test if  = 0.01?
Reject
= 0.01?
Reject  if the test statistic
  ______________.
(Short Answer)
4.8/5 (45)
The Spearman rank-correlation is a nonparametric test that 1) uses the directions of differences observed in a matched-pairs sample to determine whether the relative frequency distributions of two statistical populations are identical to or different from one another and 2) determines whether a sample comes from a population with a specified median.
(True/False)
4.9/5 (42)
Another school district also planned to evaluate two different workbooks and two distinct teaching machines to assess their effectiveness in teaching the concept of multiplication. However, the administrators in this school district consulted a statistician about the design of their study. Because they were looking for a method effective on children of all abilities, the statistician suggested they check the children's past scholastic records and divide the children into groups according to their ability level. These ability groups represent relatively homogeneous experimental units within which the comparison of teaching methods may be made. She assigned one child from each ability level to each teaching method. Twenty students participated in the study. After receiving instruction, the children took a multiplication test and the number of errors they made were recorded. 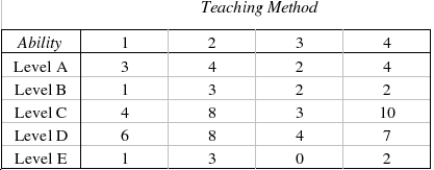 What experimental design did the statistician use?
________________________________________________________
The null and alternate hypotheses are as follows:
What experimental design did the statistician use?
________________________________________________________
The null and alternate hypotheses are as follows:  : The three population distributions are identical.
  : At least two of the three population distributions differ in location.
Describe what the test statistic
: At least two of the three population distributions differ in location.
Describe what the test statistic  is.
________________________________________________________
Test Statistic:
is.
________________________________________________________
Test Statistic:  = ______________
Reject Region:
Reject
= ______________
Reject Region:
Reject  if F > ______________
Conclude: ______________
The teaching methods ______________ equally effective.
Estimate the observed significance level of this test.
______________
if F > ______________
Conclude: ______________
The teaching methods ______________ equally effective.
Estimate the observed significance level of this test.
______________
(Essay)
4.7/5 (38)
Filters
- Essay(0)
- Multiple Choice(0)
- Short Answer(0)
- True False(0)
- Matching(0)