Exam 15: Nonparametric Statistics
Exam 1: Describing Data With Graphs94 Questions
Exam 2: Describing Data With Numerical Measures186 Questions
Exam 3: Describing Bivariate Data35 Questions
Exam 4: Probability and Probability Distributions136 Questions
Exam 5: Several Useful Discrete Distributions129 Questions
Exam 6: The Normal Probability Distribution196 Questions
Exam 7: Sampling Distributions162 Questions
Exam 8: Large-Sample Estimation173 Questions
Exam 9: Large-Sample Tests of Hypotheses210 Questions
Exam 10: Inference From Small Samples261 Questions
Exam 11: The Analysis of Variance156 Questions
Exam 12: Linear Regression and Correlation165 Questions
Exam 13: Multiple Regression Analysis178 Questions
Exam 14: Analysis of Categorical Data136 Questions
Exam 15: Nonparametric Statistics198 Questions
Select questions type
Which of the following will never be a required condition of a nonparametric test?
(Multiple Choice)
4.9/5  (36)
(36)
If Friedman test is applied to a data set that are generated from a randomized block experiment with 4 treatments and 8 blocks, then the rejection region at the 5% significance level is:
(Multiple Choice)
5.0/5 (30)
An experiment was conducted to examine the effect of age on heart rate when a person is subjected to a specific amount of exercise. Ten men randomly selected from each of four age groups: 10-19, 20-39, 40-59, and 60-69. Each man walked a treadmill at a fixed grade for a period of 12 minutes, and the increase in heart rate (the difference before and after exercise) was recorded (in beats per minute). The data are shown in the table. 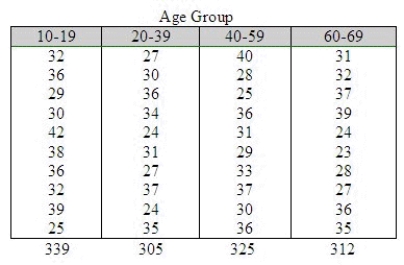 Do the data present sufficient evidence to indicate differences in location for at least two of the four age groups? Test using the Kruskal-Wallis H test with
  = 0.01.
What is H?
______________
What is the critical value for the test statistic?
Reject
= 0.01.
What is H?
______________
What is the critical value for the test statistic?
Reject  if H > ______________
Conclude: ______________
There is ______________ of a difference in location.
Find the approximate p-value for the test above.
______________
if H > ______________
Conclude: ______________
There is ______________ of a difference in location.
Find the approximate p-value for the test above.
______________
(Short Answer)
4.8/5 (36)
A parametric test is a hypothesis test that depends on certain specific assumptions about the probability distribution of population values or the sizes of population parameters.
(True/False)
4.8/5 (37)
The Kruskal-Wallis H test is an extension of the Wilcoxon rank-sum test from two to more than two statistical populations.
(True/False)
4.7/5 (28)
Kruskal-Wallis test is a nonparametric test that can be used to compare more than two independent samples when the assumptions for an analysis of variance are invalid.
(True/False)
4.9/5 (38)
The Wilcoxon signed-rank test is a nonparametric test that 1) uses the directions of differences observed in a matched pairs sample to determine whether the relative frequency distributions of two statistical populations are identical to or different from one another and 2) determines whether a sample comes from a population with a specified median.
(True/False)
4.8/5 (40)
The critical value is taken from the F-distribution whenever the test is a Kruskal-Wallis test.
(True/False)
4.9/5 (33)
In general, before an academic publisher agrees to publish a book, each manuscript is thoroughly reviewed by university professors. Suppose that the Duxbury Publishing Company has recently received two manuscripts for statistics books. To help them decide which one to publish both are sent to 30 professors of statistics who rate the manuscripts to judge which one is better. Suppose that 10 Professors rate manuscript 1 better and 20 rate manuscript 2 better. Can Duxbury conclude at the 5% significance level that manuscript 2 is more highly rated than manuscript 1?
z-statistic = ______________
Reject  if z < ______________
Conclusion: ______________
Duxbury ______________ conclude at the 5% significance level that manuscript 2 is more highly rated than manuscript 1.
What is the p-value of the test you just conducted?
______________
if z < ______________
Conclusion: ______________
Duxbury ______________ conclude at the 5% significance level that manuscript 2 is more highly rated than manuscript 1.
What is the p-value of the test you just conducted?
______________
(Short Answer)
4.9/5 (36)
The Wilcoxon rank sum test is used to compare two populations when the samples are independent but not normally distributed.
(True/False)
4.7/5 (40)
Which of the following distributions approximate Kruskal-Wallis test statistic H when the problem objective is to compare k distributions and the sample sizes are greater than or equal to 5?
(Multiple Choice)
4.8/5 (33)
The restaurant critic on a newspaper claims that the hamburgers that one gets at the hamburger chain restaurants are all equally bad and that people who claim to like one hamburger over others are victims of advertising. In fact, he claims that if there were no differences in appearance, then all hamburgers would be rated equally. To test the critic's assertion, ten teenagers are asked to taste hamburgers from three different fast-food chains. Each hamburger is dressed in the same way (mustard, relish, tomato, and pickle) with the same type of bun. The teenagers taste each hamburger and rate it on a 9-point scale with 1 = bad and 9 = excellent. The data are listed below. 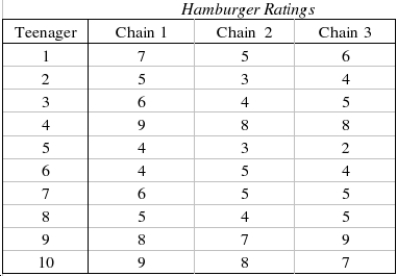 Which statistical technique is appropriate if you want to compare the quality of hamburger of the three chain restaurants?
______________
Can we infer at the 1% significance level that the critic is wrong?
Test Statistic: ______________
Reject Region:
Reject
Which statistical technique is appropriate if you want to compare the quality of hamburger of the three chain restaurants?
______________
Can we infer at the 1% significance level that the critic is wrong?
Test Statistic: ______________
Reject Region:
Reject  if the test statistic > ______________
Conclude: ______________
We ______________ infer at the 1% significance level that the critic is wrong.
Using the appropriate statistical table, what statement can be made about the p-value for this test?
______________
if the test statistic > ______________
Conclude: ______________
We ______________ infer at the 1% significance level that the critic is wrong.
Using the appropriate statistical table, what statement can be made about the p-value for this test?
______________
(Short Answer)
4.8/5 (29)
A nonparametric test is one that makes no assumptions about the specific shape of the population from which a sample is drawn.
(True/False)
4.9/5 (42)
Use the Wilcoxon rank sum test on the data below to determine at the 10% significance level whether the two population locations differ.  The null and alternate hypotheses are:
  : The two population locations are the same.
  : The two population locations are different.
Test statistic = ______________
Critical Value = ______________
Conclusion: ______________
The two population locations are ______________.
: The two population locations are different.
Test statistic = ______________
Critical Value = ______________
Conclusion: ______________
The two population locations are ______________.
(Short Answer)
4.9/5 (29)
Consider the following two independent samples: Sample A: 16 17 19 22 47
Sample B: 27 31 34 37 40
The value of the test statistic for a left-tailed Wilcoxon rank sum test is:
(Multiple Choice)
4.9/5 (29)
In a Wilcoxon rank sum test for independent samples, the two sample sizes are 4 and 6, and the value of the Wilcoxon test statistic is T = 25. If the test is a two-tail and the level of significance is 0.05, then the null hypothesis will be rejected.
(True/False)
4.8/5 (32)
A Wilcoxon rank sum test for comparing two populations involves two independent samples of sizes 15 and 20. The un-standardized test statistic (that is the rank sum) is T = 210. The value of the standardized test statistic z is:
(Multiple Choice)
4.8/5 (42)
The marketing manager of a pizza chain is in the process of examining some of the demographic characteristics of her customers. In particular, she would like to investigate the belief that the ages of the customers of pizza parlors, hamburger emporiums, and fast-food chicken restaurants are different. As an experiment, the ages of eight customers of each of the restaurants are recorded and listed below. From previous analysis we know that the ages are not normally distributed. 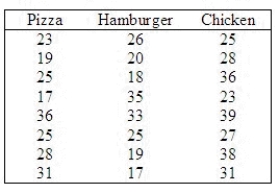 Do these data provide enough evidence at the 10% significance level to infer that there are differences in ages among the customers of the three restaurants?
Test statistic: H = ______________
Reject
Do these data provide enough evidence at the 10% significance level to infer that there are differences in ages among the customers of the three restaurants?
Test statistic: H = ______________
Reject  if H > ______________
Conclude: ______________
There ______________ enough evidence at the 10% significance level to infer that there are differences in ages among the customers of the three restaurants.
if H > ______________
Conclude: ______________
There ______________ enough evidence at the 10% significance level to infer that there are differences in ages among the customers of the three restaurants.
(Short Answer)
4.9/5 (45)
The sign test is employed to compare two populations when the experimental design is matched pairs, and the data are ordinal but not normally distributed.
(True/False)
4.8/5 (33)
Filters
- Essay(0)
- Multiple Choice(0)
- Short Answer(0)
- True False(0)
- Matching(0)