Exam 12: Linear Regression and Correlation
Exam 1: Describing Data With Graphs94 Questions
Exam 2: Describing Data With Numerical Measures186 Questions
Exam 3: Describing Bivariate Data35 Questions
Exam 4: Probability and Probability Distributions136 Questions
Exam 5: Several Useful Discrete Distributions129 Questions
Exam 6: The Normal Probability Distribution196 Questions
Exam 7: Sampling Distributions162 Questions
Exam 8: Large-Sample Estimation173 Questions
Exam 9: Large-Sample Tests of Hypotheses210 Questions
Exam 10: Inference From Small Samples261 Questions
Exam 11: The Analysis of Variance156 Questions
Exam 12: Linear Regression and Correlation165 Questions
Exam 13: Multiple Regression Analysis178 Questions
Exam 14: Analysis of Categorical Data136 Questions
Exam 15: Nonparametric Statistics198 Questions
Select questions type
In simple linear regression analysis, if the independent variable x and the dependent variable y are highly correlated, this does not only mean that they are linearly related, but it also means that a change in x will cause a change in y.
(True/False)
4.8/5  (29)
(29)
In a simple linear regression problem, if the coefficient of determination is 0.95, this means that 95% of the variation in the independent variable x can be explained by regression line.
(True/False)
4.7/5 (39)
A regression analysis between sales (in $1000) and advertising (in $) resulted in the following least squares line:  = 80,000 + 5x. This implies that:
(Multiple Choice)
4.9/5 (21)
In a simple linear regression setting, the probabilistic model equation allows for some deviation of the points about the regression line, making it a more practical model.
(True/False)
4.8/5 (36)
If the coefficient of determination is 0.982, then the slope of the regression line must be positive.
(True/False)
4.8/5 (28)
The general manager of a chain of furniture stores believes that experience is the most important factor in determining the level of success of a salesperson. To examine this belief she records last month's sales (in $1,000s) and the years of experience of 10 randomly selected salespeople. These data are listed below. 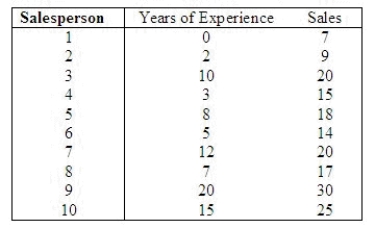 Predict with 95% confidence the monthly sales of a salesperson with 10 years of experience.
CI = ______________ Enter (n1, n2) in thousands
Estimate with 95% confidence the average monthly sales of all salespersons with 10 years of experience.
CI = ______________ Enter (n1, n2) in thousands
Which interval in the previous two questions is narrower: the confidence interval estimate of the expected value of y or the prediction interval for the same given value of x (10 years) and same confidence level?
______________
Why?
________________________________________________________
Predict with 95% confidence the monthly sales of a salesperson with 10 years of experience.
CI = ______________ Enter (n1, n2) in thousands
Estimate with 95% confidence the average monthly sales of all salespersons with 10 years of experience.
CI = ______________ Enter (n1, n2) in thousands
Which interval in the previous two questions is narrower: the confidence interval estimate of the expected value of y or the prediction interval for the same given value of x (10 years) and same confidence level?
______________
Why?
________________________________________________________
(Essay)
4.8/5 (39)
A scientist is studying the relationship between x = density (in number per square meter) of aspen trees around a pond and y = beaver abundance. The following statistical software output is from a regression analysis for predicting y from x. 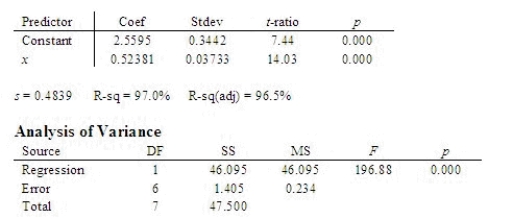 What is the least-squares regression equation?
  = ______________
What is the estimated slope?
b = ______________
What is the estimated y-intercept?
a = ______________
What is the value of the error sum of squares?
______________
What is the value of the coefficient of determination?
______________
What is the percentage of variation in beaver abundance accounted for by regression on the density of aspen trees?
______________
= ______________
What is the estimated slope?
b = ______________
What is the estimated y-intercept?
a = ______________
What is the value of the error sum of squares?
______________
What is the value of the coefficient of determination?
______________
What is the percentage of variation in beaver abundance accounted for by regression on the density of aspen trees?
______________
(Short Answer)
4.8/5 (34)
Given a specific value of x and confidence level, which of the following statements is correct?
(Multiple Choice)
4.8/5 (40)
The least squares method for determining the best fit minimizes:
(Multiple Choice)
4.7/5 (33)
In a simple linear regression analysis, if SSE = 27, Total SS = 63, then the percentage of the variation in the dependent variable y that is explained by the independent variable x is about:
(Multiple Choice)
4.9/5 (34)
A company manager is interested in the relationship between x = number of years that an employee has been with the company and y = the employee's annual salary (in thousands of dollars). The following MINITAB output is from a regression analysis for predicting y from x for n = 15 data points. 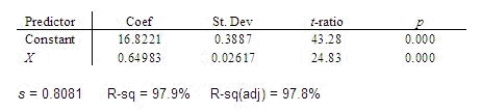 What is the least squares regression equation?
  = ______________
What are the least squares estimates of the slope?
______________
What are the least squares estimates of the y-intercept?
______________
Interpret the estimated slope.
________________________________________________________
Interpret the estimated y-intercept.
______________
What is the value of
= ______________
What are the least squares estimates of the slope?
______________
What are the least squares estimates of the y-intercept?
______________
Interpret the estimated slope.
________________________________________________________
Interpret the estimated y-intercept.
______________
What is the value of  ?
______________
What is the value of the sum of squares for error (SSE)?
______________
Find the coefficient of determination.
______________
Interpret the coefficient of determination.
________________________________________________________
Does a linear relationship exist between x and y? Test using
?
______________
What is the value of the sum of squares for error (SSE)?
______________
Find the coefficient of determination.
______________
Interpret the coefficient of determination.
________________________________________________________
Does a linear relationship exist between x and y? Test using  = 0.05.
What is the p-value?
______________
Conclude:
______________
A linear relationship ______________ exist between x and y.
= 0.05.
What is the p-value?
______________
Conclude:
______________
A linear relationship ______________ exist between x and y.
(Essay)
4.7/5 (30)
If the coefficient of determination is 0.975, then the slope of the regression line:
(Multiple Choice)
4.9/5 (41)
Let x be the number of pieces of furniture in a delivery truck and y be the time (in hours) it takes the delivery person to deliver all the pieces of furniture. A simple linear regression analysis related x and y where the least squares estimates of the regression parameters are a = 1.85 and b = 0.55.
What is the least squares best-fitting regression line?  = ______________
What is the slope of the equation?
______________
Interpret the slope of the equation. Does a positive slope make practical sense? Justify your answer.
________________________________________________________
What is the y-intercept?
______________
Interpret the y-intercept, does this make sense?
________________________________________________________
Use the least squares regression line to estimate the time it should take to deliver 10 pieces of furniture. (You may assume that 10 is in the range of the data.)
______________ (hours)
= ______________
What is the slope of the equation?
______________
Interpret the slope of the equation. Does a positive slope make practical sense? Justify your answer.
________________________________________________________
What is the y-intercept?
______________
Interpret the y-intercept, does this make sense?
________________________________________________________
Use the least squares regression line to estimate the time it should take to deliver 10 pieces of furniture. (You may assume that 10 is in the range of the data.)
______________ (hours)
(Essay)
4.8/5 (30)
When regression analysis is used for prediction, the confidence interval for the average y given x will be wider than the prediction interval for a particular value of y given x.
(True/False)
4.7/5 (29)
If an estimated regression line has a y-intercept of 10 and a slope of 4, then when x = 2 the actual value of y is:
(Multiple Choice)
4.9/5 (35)
In order to predict with 98% confidence the expected value of y for a given value of x in a simple linear regression problem, a random sample of 15 observations is taken. Which of the following t-table values listed below would be used?
(Multiple Choice)
4.9/5 (24)
Six points have these coordinates: 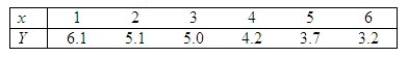 The normal probability plot and the residuals versus fitted values plots generated by Minitab are shown below.
 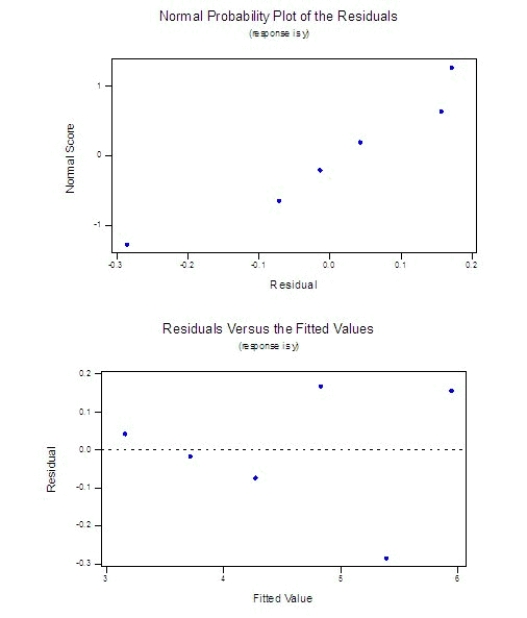 Does it appear that any regression assumptions have been violated?
______________
Explain.
________________________________________________________
Does it appear that any regression assumptions have been violated?
______________
Explain.
________________________________________________________
(Essay)
4.8/5 (34)
A regression line using 25 observations produced SSR = 118.68 and SSE = 56.32. The standard error of estimate was:
(Multiple Choice)
4.8/5 (40)
In simple linear regression, the plot of residuals versus fitted values 3 can be used to check for:
(Multiple Choice)
4.8/5 (48)
Filters
- Essay(0)
- Multiple Choice(0)
- Short Answer(0)
- True False(0)
- Matching(0)