Exam 12: Linear Regression and Correlation
Exam 1: Describing Data With Graphs94 Questions
Exam 2: Describing Data With Numerical Measures186 Questions
Exam 3: Describing Bivariate Data35 Questions
Exam 4: Probability and Probability Distributions136 Questions
Exam 5: Several Useful Discrete Distributions129 Questions
Exam 6: The Normal Probability Distribution196 Questions
Exam 7: Sampling Distributions162 Questions
Exam 8: Large-Sample Estimation173 Questions
Exam 9: Large-Sample Tests of Hypotheses210 Questions
Exam 10: Inference From Small Samples261 Questions
Exam 11: The Analysis of Variance156 Questions
Exam 12: Linear Regression and Correlation165 Questions
Exam 13: Multiple Regression Analysis178 Questions
Exam 14: Analysis of Categorical Data136 Questions
Exam 15: Nonparametric Statistics198 Questions
Select questions type
A regression analysis between weight (y in pounds) and height (x in inches) resulted in the following least squares line:  = 135 + 6x. This implies that if the height is increased by 1 inch, the weight is expected to increase by an average of 6 pounds.
(True/False)
4.9/5  (37)
(37)
Given that  500,
500,  , cov (x, y) = 100, and n = 6, the standard error of estimate is:
(Multiple Choice)
4.9/5 (34)
In regression analysis, a graph of each residual against the corresponding fitted value is called a scatter diagram.
(True/False)
4.9/5 (40)
A measure of how well an estimated regression line fits the sample data on which it is based, denoted by  (and equal to the proportion of the total variation in the values of the dependent variable, y, that can be explained by the association of y with x as measured by the estimated regression line) is known as:
(Multiple Choice)
4.8/5 (31)
In a simple linear regression problem, the following sum of squares are produced:  . The percentage of the variation in y that is explained by the variation in x is:
(Multiple Choice)
4.8/5 (38)
A university admissions committee was interested in examining the relationship between a student's score on the SAT exam, x, and the student's grade point average, y, (GPA) at the end the student's freshman year of college. The committee selected a random sample of 25 students and recorded the SAT score and GPA at the end of the freshman year of college for each student. Use the following output that was generated using Minitab to answer the questions below: 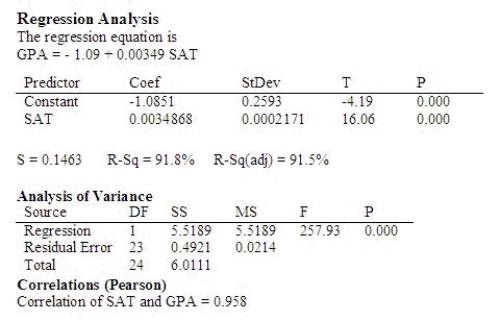 Use the printout to find the least-square prediction line.
  = ______________
Find the estimated GPA at the end of the freshman year for a student who scored 1175 on the SAT exam.
______________
What is the coefficient of determination?
______________
Interpret the coefficient of determination.
______________
Use the p-value approach to test the usefulness of the linear regression model at the 0.05 level of significance.
p-value:
______________
Conclude:
______________
There ______________ a significant linear relationship between a student's SAT score and the student's GPA at the end of the freshman year of college.
= ______________
Find the estimated GPA at the end of the freshman year for a student who scored 1175 on the SAT exam.
______________
What is the coefficient of determination?
______________
Interpret the coefficient of determination.
______________
Use the p-value approach to test the usefulness of the linear regression model at the 0.05 level of significance.
p-value:
______________
Conclude:
______________
There ______________ a significant linear relationship between a student's SAT score and the student's GPA at the end of the freshman year of college.
(Short Answer)
4.9/5 (36)
The standard error of the estimate in a simple linear regression model measures the variation in the slope coefficient from sample to sample.
(True/False)
4.9/5 (35)
In a simple linear regression model, if the independent and dependent variables are negatively linearly related, then the standard error of the estimate will also be negative.
(True/False)
4.9/5 (35)
A regression analysis between weight (y in pounds) and height (x in inches) resulted in the following least squares line:  = 128 + 6x. This implies that if the height is increased by 1 inch, the weight on average is expected to:
(Multiple Choice)
4.9/5 (35)
The manager of an ice cream store is interested in examining the relationship between sales of ice cream (in gallons per day) and maximum temperature of the day. The vendor records the following data for a random sample of five days in the summer, where y is number of gallons of ice cream sold per day and x is maximum temperature, in degrees Fahrenheit, recorded for the day: 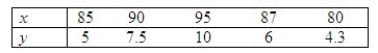 The following summary information were computed:
 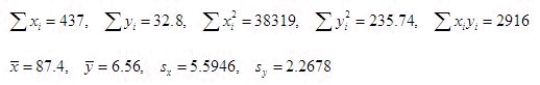 Find and interpret the correlation between maximum daily temperature and daily sales of ice cream.
Syy = ______________
What is the correlation coefficient?
r = ______________
There is ______________ linear relationship between daily sales of ice cream and maximum daily temperature.
Find and interpret the correlation between maximum daily temperature and daily sales of ice cream.
Syy = ______________
What is the correlation coefficient?
r = ______________
There is ______________ linear relationship between daily sales of ice cream and maximum daily temperature.
(Short Answer)
4.8/5 (37)
A perfect correlation between two variables will always produce a correlation coefficient of + 1.0.
(True/False)
4.9/5 (40)
In a simple linear regression model, if you found that the true regression coefficient is significantly greater than zero, then you may also conclude that the two variables are positively correlated.
(True/False)
4.9/5 (28)
A dependent variable is the variable that we wish to predict in a regression model.
(True/False)
4.7/5 (28)
If the true correlation between two variables is zero, then which of the following statements is true?
(Multiple Choice)
4.9/5 (42)
In order to predict with 95% confidence a particular value of y for a given value of x in a simple linear regression problem, a random sample of 20 observations is taken. The appropriate table value that would be used is 2.101.
(True/False)
4.9/5 (40)
Which value of the coefficient of correlation r indicates a stronger correlation than 0.65?
(Multiple Choice)
4.8/5 (36)
A regression analysis between sales (in $1000) and advertising (in $100) resulted in the following least squares line:  = 75 +6x. This implies that if advertising is $800, then the predicted amount of sales (in dollars) is:
(Multiple Choice)
4.9/5 (30)
If all the points in a scatterplot lie on the least squares regression line, then the correlation coefficient must be 1.0
(True/False)
4.8/5 (32)
If there is a negative correlation between the independent variable x and the dependent variable y, then to test this, the appropriate null and alternative hypotheses would be 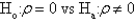 .
.
(True/False)
4.9/5 (32)
If the correlation coefficient for two variables is found to be .094, then the scatterplot will show the data upward sloping from lower left to upper right.
(True/False)
4.9/5 (38)
Filters
- Essay(0)
- Multiple Choice(0)
- Short Answer(0)
- True False(0)
- Matching(0)