Exam 12: Linear Regression and Correlation
Exam 1: Describing Data With Graphs94 Questions
Exam 2: Describing Data With Numerical Measures186 Questions
Exam 3: Describing Bivariate Data35 Questions
Exam 4: Probability and Probability Distributions136 Questions
Exam 5: Several Useful Discrete Distributions129 Questions
Exam 6: The Normal Probability Distribution196 Questions
Exam 7: Sampling Distributions162 Questions
Exam 8: Large-Sample Estimation173 Questions
Exam 9: Large-Sample Tests of Hypotheses210 Questions
Exam 10: Inference From Small Samples261 Questions
Exam 11: The Analysis of Variance156 Questions
Exam 12: Linear Regression and Correlation165 Questions
Exam 13: Multiple Regression Analysis178 Questions
Exam 14: Analysis of Categorical Data136 Questions
Exam 15: Nonparametric Statistics198 Questions
Select questions type
The following are coefficients of correlation (r). The one that indicates a strong positive linear relationship between the two variables of interest is:
(Multiple Choice)
4.9/5  (32)
(32)
In a regression problem the following pairs of (x, y) are given: (4, 1), (4, -1), (4, 0), (4, -2) and (4, 2). That indicates that:
(Multiple Choice)
4.9/5 (40)
In developing a 90% confidence interval for the expected value of y from a simple linear regression problem involving a sample of size 15, the appropriate table value would be 1.761.
(True/False)
4.9/5 (30)
In order to predict with 90% confidence the expected value of y for a given value of x in a simple linear regression problem, a random sample of 10 observations is taken. Which of the following t-table values listed below would be used?
(Multiple Choice)
4.9/5 (34)
Which of the following correctly describes a true regression line?
(Multiple Choice)
4.9/5 (39)
Which of the following is not an assumption for the simple linear regression model?
(Multiple Choice)
4.8/5 (37)
In regression analysis, if the coefficient of determination is 1.0, then:
(Multiple Choice)
4.9/5 (27)
If the coefficient of correlation is 0.90, then the percentage of the variation in the dependent variable y that is explained by the variation in the independent variable x is:
(Multiple Choice)
4.8/5 (31)
Which of the following correctly describes an estimated regression line?
(Multiple Choice)
4.8/5 (29)
Regression analysis is a statistical method that seeks to establish an equation that allows the unknown value of one variable to be estimated from the known value of one or more other variables.
(True/False)
4.7/5 (34)
A scientist is studying the relationship between x = inches of annual rainfall and y = inches of shoreline erosion. One study reported the following data. Use the following MINITAB output to answer the questions below. 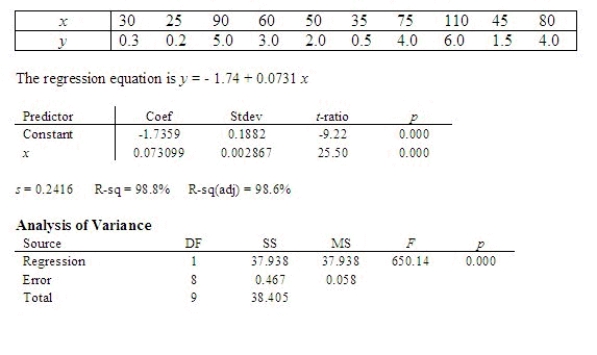 What is the equation of the estimated regression line?
  = ______________
Interpret the estimated slope of the regression line.
________________________________________________________
Is the simple linear regression model useful for predicting erosion from a given amount of rainfall?
What is the p-value?
______________
Conclude:
______________
A linear relationship ______________ exist between x and y.
The simple linear regression model ______________ useful for predicting erosion from a given amount of rainfall.
Identify the coefficient of determination.
______________
Interpret the coefficient of determination.
________________________________________________________
= ______________
Interpret the estimated slope of the regression line.
________________________________________________________
Is the simple linear regression model useful for predicting erosion from a given amount of rainfall?
What is the p-value?
______________
Conclude:
______________
A linear relationship ______________ exist between x and y.
The simple linear regression model ______________ useful for predicting erosion from a given amount of rainfall.
Identify the coefficient of determination.
______________
Interpret the coefficient of determination.
________________________________________________________
(Essay)
4.9/5 (46)
If two variables are related in a negative linear manner, the scatterplot will show points on the x, y space that are generally moving from the upper left to the lower right.
(True/False)
4.9/5 (29)
The general manager of a chain of furniture stores believes that experience is the most important factor in determining the level of success of a salesperson. To examine this belief she records last month's sales (in $1,000s) and the years of experience of 10 randomly selected salespeople. These data are listed below. 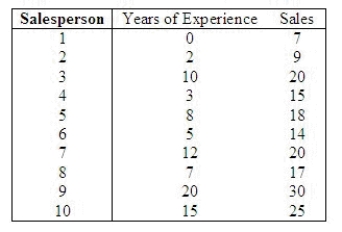 Determine the standard error of estimate.
sr = ______________
Describe what this statistic tells you about the regression line.
______________
Determine the coefficient of determination.
R2 = ______________
Discuss what its value tells you about the two variables.
______________
Calculate the Pearson correlation coefficient.
r = ______________
Why does it have the sign it has?
______________
Conduct a test of the population slope to determine at the 5% significance level whether a linear relationship exists between years of experience and sales.
Test statistic:
t = ______________
Rejection Region:
Reject H0 if | t | > ______________
Conclusion:
______________
A linear relationship ______________ between years of experience and sales.
Determine the standard error of estimate.
sr = ______________
Describe what this statistic tells you about the regression line.
______________
Determine the coefficient of determination.
R2 = ______________
Discuss what its value tells you about the two variables.
______________
Calculate the Pearson correlation coefficient.
r = ______________
Why does it have the sign it has?
______________
Conduct a test of the population slope to determine at the 5% significance level whether a linear relationship exists between years of experience and sales.
Test statistic:
t = ______________
Rejection Region:
Reject H0 if | t | > ______________
Conclusion:
______________
A linear relationship ______________ between years of experience and sales.
(Essay)
4.8/5 (34)
A direct relationship is a relationship between any two variables, Y and X, such that the value of Y is uniquely determined whenever the value of X is specified (only Y exists for each X).
(True/False)
4.9/5 (39)
A measure of how well an estimated regression line fits the sample data on which it is based (denoted by  and equal to the proportion of the total variation in the values of the dependent variable, y, that can be explained by the association of y with x as measured by the estimated regression line) is called the sample coefficient of correlation.
(True/False)
4.8/5 (33)
In regression analysis, the dependent variable is a variable whose value is unknown and is being explained or predicted with the help of another variable.
(True/False)
4.8/5 (39)
In a simple linear regression problem, the least squares line is  = -3.75 + 1.25x, and the coefficient of determination is 0.81. The coefficient of correlation must be -0.90.
(True/False)
4.9/5 (41)
Testing whether the slope of the population regression line could be zero is equivalent to testing whether:
(Multiple Choice)
4.7/5 (35)
If a least squares regression line has a y-intercept of 6.84 and a slope of 2.16, then when x = 1 the actual value of y must be 9.
(True/False)
4.8/5 (42)
In regression analysis, the so-called regression line summarizes the stochastic relationship between dependent variable y and independent x, while also minimizing the errors made when the equation of that line is employed to estimate y from x.
(True/False)
4.9/5 (43)
Filters
- Essay(0)
- Multiple Choice(0)
- Short Answer(0)
- True False(0)
- Matching(0)