Exam 12: Linear Regression and Correlation
Exam 1: Describing Data With Graphs94 Questions
Exam 2: Describing Data With Numerical Measures186 Questions
Exam 3: Describing Bivariate Data35 Questions
Exam 4: Probability and Probability Distributions136 Questions
Exam 5: Several Useful Discrete Distributions129 Questions
Exam 6: The Normal Probability Distribution196 Questions
Exam 7: Sampling Distributions162 Questions
Exam 8: Large-Sample Estimation173 Questions
Exam 9: Large-Sample Tests of Hypotheses210 Questions
Exam 10: Inference From Small Samples261 Questions
Exam 11: The Analysis of Variance156 Questions
Exam 12: Linear Regression and Correlation165 Questions
Exam 13: Multiple Regression Analysis178 Questions
Exam 14: Analysis of Categorical Data136 Questions
Exam 15: Nonparametric Statistics198 Questions
Select questions type
The residuals are observations of the error variable  . Consequently, the minimized sum of squared deviations is called the sum of squares for error, denoted SSE.
(True/False)
4.9/5  (40)
(40)
One way to measure the strength of the relationship between the response variable y and the predictor variable x is to calculate the coefficient of determination; that is, the proportion of the total variation in y that is explained by the linear regression of y on x.
(True/False)
4.8/5 (30)
In simple linear regression, if the estimated values  and the corresponding actual values
  are equal, then the standard error of estimate, SE(
  ), must equal -1.0.
(True/False)
4.7/5 (34)
The prediction interval developed from a simple linear regression model will be very narrow when the value of x used to predict y is equal to the mean value  .
.
(True/False)
4.8/5 (39)
If the coefficient of determination value for a simple linear regression model is .90, then the correlation coefficient between the two variables will be .81.
(True/False)
4.9/5 (37)
In regression analysis, the independent variable is a variable whose value is known and is being used to explain or predict the value of another variable.
(True/False)
4.9/5 (38)
Which of the following statements is false regarding the residuals in simple linear regression model?
(Multiple Choice)
4.8/5 (37)
In simple linear regression, one can use the plot of residuals versus the fitted values of y to check for a constant variance as well as to make sure that the linear model is in fact adequate.
(True/False)
4.9/5 (30)
An indication of no linear relationship between two variables x and y would be:
(Multiple Choice)
4.9/5 (37)
The sign of the correlation coefficient in a simple linear regression model will always be the same as the sign of the y-intercept coefficient  .
.
(True/False)
4.8/5 (36)
In simple linear regression, the plot of residuals versus fitted values  should:
(Multiple Choice)
4.7/5 (38)
Evidence supports using a simple linear regression model to estimate a person's weight based on a person's height. Let x be a person's height (measured in inches) and y be the person's weight (measured in pounds). A random sample of eleven people was selected and the following data recorded: 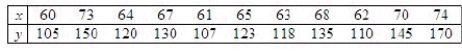 The following output was generated for the data:
 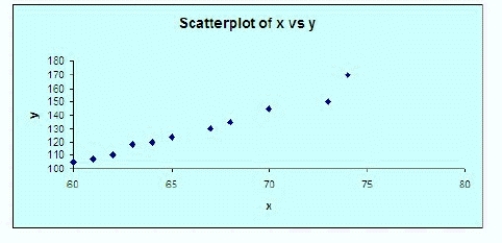 Based on the scatterplot above, does a simple linear regression model seem appropriate?
______________
Justify your answer.
________________________________________________________
Use the printout to find the least-squares prediction line.
Based on the scatterplot above, does a simple linear regression model seem appropriate?
______________
Justify your answer.
________________________________________________________
Use the printout to find the least-squares prediction line.  = ______________
Based on the printout, do there appear to be any outliers in the data?
______________
Justify your answer.
________________________________________________________
Consider the following residual plot of the residuals versus the fitted values.
= ______________
Based on the printout, do there appear to be any outliers in the data?
______________
Justify your answer.
________________________________________________________
Consider the following residual plot of the residuals versus the fitted values. 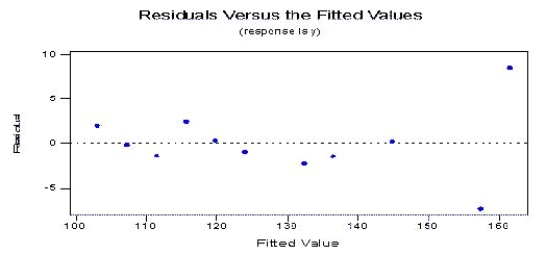 What conclusion, if any, can be drawn from the plot?
________________________________________________________
Consider the following normal probability plot of the residuals.
What conclusion, if any, can be drawn from the plot?
________________________________________________________
Consider the following normal probability plot of the residuals. 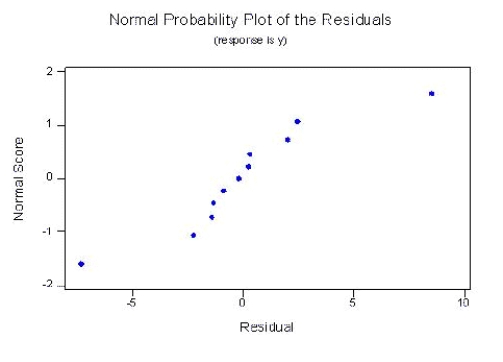 What conclusion can be drawn from the plot?
________________________________________________________
Based on the previous two plots, should you use the model in the computer printout to predict weight?
______________
Justify your answer.
________________________________________________________
What conclusion can be drawn from the plot?
________________________________________________________
Based on the previous two plots, should you use the model in the computer printout to predict weight?
______________
Justify your answer.
________________________________________________________
(Essay)
4.9/5 (39)
A professor of economics wants to study the relationship between income (y in $1000s) and education (x in years). A random sample eight individuals is taken and the results are shown below. 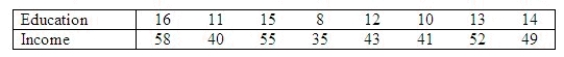 Determine the standard error of estimate.
sr = ______________
Describe what this statistic tells you about the regression line.
____________________________
Determine the coefficient of determination.
R2 = ______________
Discuss what its value tells you about the two variables.
________________________________________________________
Calculate the Pearson correlation coefficient.
r = ______________
Why does it have the sign it has?
________________________________________________________
Conduct a test of the population slope to determine at the 5% significance level whether a linear relationship exists between years of education and income.
Test statistic:
t = ______________
Rejection Region:
Reject H0 if | t | > ______________
Conclusion:
______________
A linear relationship ______________ between years of education and income.
Determine the standard error of estimate.
sr = ______________
Describe what this statistic tells you about the regression line.
____________________________
Determine the coefficient of determination.
R2 = ______________
Discuss what its value tells you about the two variables.
________________________________________________________
Calculate the Pearson correlation coefficient.
r = ______________
Why does it have the sign it has?
________________________________________________________
Conduct a test of the population slope to determine at the 5% significance level whether a linear relationship exists between years of education and income.
Test statistic:
t = ______________
Rejection Region:
Reject H0 if | t | > ______________
Conclusion:
______________
A linear relationship ______________ between years of education and income.
(Essay)
4.7/5 (42)
In a simple linear regression problem, if the coefficient of determination is 0.96, this means that:
(Multiple Choice)
4.7/5 (32)
In publishing the results of some research work, the following values of the correlation coefficient were listed. Which one would appear to be incorrect?
(Multiple Choice)
4.9/5 (31)
In a simple linear regression problem including n = 10 observations, which of the following table values would be appropriate for a 95% confidence interval estimation for the average value of y?
(Multiple Choice)
4.8/5 (37)
In a simple linear regression problem, the following statistics are calculated from a sample of 10 observations:  . The least squares estimates of the slope and y-intercept are respectively:
(Multiple Choice)
4.8/5 (32)
When the actual values y of a dependent variable and the corresponding predicted values  are the same, the standard error of estimate
  will be -1.0.
(True/False)
4.8/5 (37)
Filters
- Essay(0)
- Multiple Choice(0)
- Short Answer(0)
- True False(0)
- Matching(0)