Exam 12: Linear Regression and Correlation
Exam 1: Describing Data With Graphs94 Questions
Exam 2: Describing Data With Numerical Measures186 Questions
Exam 3: Describing Bivariate Data35 Questions
Exam 4: Probability and Probability Distributions136 Questions
Exam 5: Several Useful Discrete Distributions129 Questions
Exam 6: The Normal Probability Distribution196 Questions
Exam 7: Sampling Distributions162 Questions
Exam 8: Large-Sample Estimation173 Questions
Exam 9: Large-Sample Tests of Hypotheses210 Questions
Exam 10: Inference From Small Samples261 Questions
Exam 11: The Analysis of Variance156 Questions
Exam 12: Linear Regression and Correlation165 Questions
Exam 13: Multiple Regression Analysis178 Questions
Exam 14: Analysis of Categorical Data136 Questions
Exam 15: Nonparametric Statistics198 Questions
Select questions type
The normal probability plot is a graph that plots the residuals against the expected value of that residual if it had come from a normal distribution. When the residuals are normally distributed or approximately so, the plot should appear as a straight line, sloping upward at a 45° angle.
(True/False)
4.8/5  (29)
(29)
In developing a 80% prediction interval for the particular value of y from a simple linear regression problem involving a sample of size 12, the appropriate table value would be 1.372.
(True/False)
4.7/5 (42)
The width of the confidence interval estimate for the predicted value of y depends on:
(Multiple Choice)
5.0/5 (33)
If the correlation coefficient between two variables is very close to zero, this means that there is no relationship between the two variables.
(True/False)
4.7/5 (38)
When the actual values y of a dependent variable and the corresponding predicted values  are the same, the standard error of estimate
  will be 0.0.
(True/False)
4.9/5 (28)
If a simple linear regression model is developed based on a sample where the independent and dependent variables are known to be negatively related, then the sum of squares for error will be negative also.
(True/False)
4.8/5 (28)
Large coefficient of determination value will result in a small standard error of the estimate for the regression model, thus providing prediction intervals that are narrow.
(True/False)
4.9/5 (40)
The value of the sum of squares for regression SSR can never be smaller than 0.0.
(True/False)
4.8/5 (29)
Which of the following statements about simple correlation analysis are correct?
(Multiple Choice)
4.8/5 (33)
Given that n = 37, and the value of sample Spearman rank correlation coefficient  = 0.35, the value of the test statistic for testing
  .
.
(True/False)
4.8/5 (36)
Given that the sum of squares for error (SSE) is 52 and the sum of squares for regression (SSR) is 148, then the coefficient of determination is 0.74.
(True/False)
4.8/5 (39)
The confidence interval estimate of the expected value of y for a given value y x, compared to the prediction interval of y for the same given value of x and confidence level, will be:
(Multiple Choice)
4.8/5 (48)
Let x be the weight (in tons) of a load of lumber and y be the time (in hours) it takes to load it on a truck. A simple linear regression model relates x and y where the least squares estimates of the regression parameters are b = 6.5 and a = 3.3.
What is the least-squares best-fitting regression line?  = ______________
What is the average change in time per one ton increase in weight?
______________ (hours)
What is the estimated time it takes to load 9 tons of lumber?
______________ (hours)
Interpret the y -intercept of the regression line.
________________________________________________________
= ______________
What is the average change in time per one ton increase in weight?
______________ (hours)
What is the estimated time it takes to load 9 tons of lumber?
______________ (hours)
Interpret the y -intercept of the regression line.
________________________________________________________
(Essay)
4.8/5 (31)
The vertical spread of the data points about the regression line is measured by the y-intercept.
(True/False)
4.9/5 (38)
The method of least squares requires that the sum of the squared deviations between actual y values in the scatter diagram and y values predicted by the regression line be minimized.
(True/False)
4.8/5 (30)
An ardent fan of television game shows has observed that, in general, the more educated the contestant, the less money he or she wins. To test her belief she gathers data about the last eight winners of her favorite game show. She records their winnings in dollars and the number of years of education. The results are as follows. 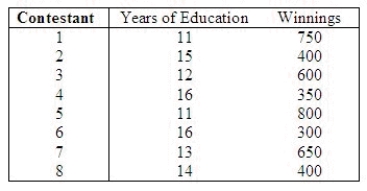 Predict with 95% confidence the winnings of a contestant who has 15 years of education.
CI = ______________ Enter (n1, n2)
Predict with 95% confidence the winnings of a contestant who has 10 years of education.
CI = ______________ Enter (n1, n2)
Estimate with 95% confidence the average winnings of all contestants who have 15 years of education.
CI = ______________ Enter (n1, n2)
Estimate with 95% confidence the average winnings of all contestants who have 10 years of education.
CI = ______________ Enter (n1, n2)
Predict with 95% confidence the winnings of a contestant who has 15 years of education.
CI = ______________ Enter (n1, n2)
Predict with 95% confidence the winnings of a contestant who has 10 years of education.
CI = ______________ Enter (n1, n2)
Estimate with 95% confidence the average winnings of all contestants who have 15 years of education.
CI = ______________ Enter (n1, n2)
Estimate with 95% confidence the average winnings of all contestants who have 10 years of education.
CI = ______________ Enter (n1, n2)
(Short Answer)
4.7/5 (37)
In developing a 95% confidence interval for the expected value of y from a simple linear regression problem involving a sample of size 10, the appropriate table value would be 1.86.
(True/False)
4.8/5 (35)
The values of a and  found in the equation of the true regression line, E(y) =
  , represent the line's y-intercept and slope, respectively, and are called true regression coefficients.
(True/False)
4.9/5 (27)
In developing a scatterplot, you have the option of connecting the points or not.
(True/False)
5.0/5 (33)
In a sample linear regression model, the slope coefficient  represents the average change in the independent variable x for a one unit change in the dependent variable y.
(True/False)
4.8/5 (29)
Filters
- Essay(0)
- Multiple Choice(0)
- Short Answer(0)
- True False(0)
- Matching(0)