Exam 12: Linear Regression and Correlation
Exam 1: Describing Data With Graphs94 Questions
Exam 2: Describing Data With Numerical Measures186 Questions
Exam 3: Describing Bivariate Data35 Questions
Exam 4: Probability and Probability Distributions136 Questions
Exam 5: Several Useful Discrete Distributions129 Questions
Exam 6: The Normal Probability Distribution196 Questions
Exam 7: Sampling Distributions162 Questions
Exam 8: Large-Sample Estimation173 Questions
Exam 9: Large-Sample Tests of Hypotheses210 Questions
Exam 10: Inference From Small Samples261 Questions
Exam 11: The Analysis of Variance156 Questions
Exam 12: Linear Regression and Correlation165 Questions
Exam 13: Multiple Regression Analysis178 Questions
Exam 14: Analysis of Categorical Data136 Questions
Exam 15: Nonparametric Statistics198 Questions
Select questions type
In the least squares regression line  = 3 - 2x, the predicted value of y equals:
(Multiple Choice)
4.8/5  (40)
(40)
If there is no linear relationship between two variables x and y, the coefficient of determination must be  1.0.
1.0.
(True/False)
4.7/5 (29)
The value of the sum of squares for error (SSE) can never be larger than the total sum of squares (Total SS).
(True/False)
4.8/5 (44)
A regression analysis between sales (y in $1000) and advertising (x in $100) resulted in the following least squares line:  = 82 +7x. This implies that if advertising is $900, then the predicted amount of sales (in dollars) is:
(Multiple Choice)
4.9/5 (36)
In developing a 90% confidence interval for the average value of y from a simple linear regression problem involving 12 observations, the appropriate table value would be 1.796.
(True/False)
4.8/5 (41)
In studying the relationship between two variables x and y, a scatterplot can be used to detect which of the following?
(Multiple Choice)
4.8/5 (37)
The values of  and b found in the equation of the estimated regression line,
  , represent the line's y-intercept and slope, respectively, and are called estimated regression coefficients.
(True/False)
4.9/5 (41)
The following are coefficients of correlation (r). The one that indicates a strong negative linear relationship between the two variables of interest is:
(Multiple Choice)
4.7/5 (35)
If all of the values of an independent variable x are equal, then regressing a dependent variable y on this independent variable x will result in a coefficient of determination (  ) equal to:
(Multiple Choice)
5.0/5 (37)
If a sample of 25 observations is selected, and the sample correlation coefficient between the variables x and y is r = 0.525, what is the test statistic value for testing 
(Multiple Choice)
4.8/5 (33)
A microwave manufacturer has collected the data shown below on number of units sold (y) in the thousands of dollars and the number of ads (x) placed during the month. 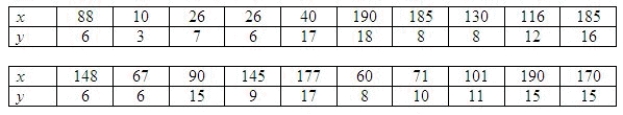 Calculate the preliminary sums of squares and cross-products.
Sxx = ______________
Syy = ______________
Sxy = ______________
Calculate:
SSE = ______________
MSE = ______________
Determine the least-squares regression line.
Calculate the preliminary sums of squares and cross-products.
Sxx = ______________
Syy = ______________
Sxy = ______________
Calculate:
SSE = ______________
MSE = ______________
Determine the least-squares regression line.  = ______________
Compute a point estimate of number of units sold if there are 140 ads.
______________
Compute the standard error of the point estimate of number of units sold if there are 140 ads.
______________
Compute a 95% confidence interval for the average number of units sold in all months with 140 ads.
______________ Enter (n1, n2)
Compute a 95% prediction interval for sales during the next month that happens to be associated with 140 ads.
______________ Enter (n1, n2)
= ______________
Compute a point estimate of number of units sold if there are 140 ads.
______________
Compute the standard error of the point estimate of number of units sold if there are 140 ads.
______________
Compute a 95% confidence interval for the average number of units sold in all months with 140 ads.
______________ Enter (n1, n2)
Compute a 95% prediction interval for sales during the next month that happens to be associated with 140 ads.
______________ Enter (n1, n2)
(Short Answer)
4.7/5 (35)
In the simple linear regression model  which of the following is true regarding the values of the random error term
  ?
?
(Multiple Choice)
4.8/5 (37)
In a simple linear regression analysis, the standard error of the slope is:
(Multiple Choice)
5.0/5 (47)
For the values of the coefficient of determination listed below, which one yields the greatest value of sum of squares for regression given that the total sum of squares is 200?
(Multiple Choice)
4.9/5 (36)
Simple regression analysis is a statistical technique that establishes an index that provides, in a single number, a measure of the strength of association between two variables.
(True/False)
4.7/5 (35)
Given the least squares regression line  = -4.63 + 1.38x, and a coefficient of determination of 0.9025, the correlation coefficient must be:
(Multiple Choice)
4.9/5 (41)
A stochastic relationship is a relationship between any two variables, Y and X, such that many possible values of Y can be associated with any one value of X.
(True/False)
4.8/5 (36)
Given that the sum of squares for error is 60 and the sum of squares for regression is 140, then the coefficient of determination is:
(Multiple Choice)
4.9/5 (33)
A study of 20 students showed that the correlation between the time spent writing a test and the number of hours studied the night before the test was 0.35. Using a level of significance equal to 0.05, which of the following statements is true?
(Multiple Choice)
4.8/5 (31)
A university admissions committee was interested in examining the relationship between a student's score on the SAT exam, x, and the student's grade point average, y, (GPA) at the end the student's freshman year of college. The committee selected a random sample of 25 students and recorded the SAT score and GPA at the end of the freshman year of college for each student. Use the following output that was generated using Minitab to answer the questions below: 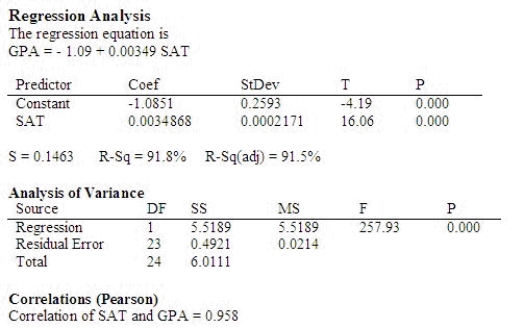 Determine the correlation between a student's SAT score and GPA at the end of the freshman year.
Since b is ______________ the correlation is ______________.
Interpret the value.
There is a ______________ linear relationship between a student's SAT score and GPA at the end of the freshman year.
Determine the correlation between a student's SAT score and GPA at the end of the freshman year.
Since b is ______________ the correlation is ______________.
Interpret the value.
There is a ______________ linear relationship between a student's SAT score and GPA at the end of the freshman year.
(Short Answer)
5.0/5 (45)
Filters
- Essay(0)
- Multiple Choice(0)
- Short Answer(0)
- True False(0)
- Matching(0)