Exam 12: Linear Regression and Correlation
Exam 1: Describing Data With Graphs94 Questions
Exam 2: Describing Data With Numerical Measures186 Questions
Exam 3: Describing Bivariate Data35 Questions
Exam 4: Probability and Probability Distributions136 Questions
Exam 5: Several Useful Discrete Distributions129 Questions
Exam 6: The Normal Probability Distribution196 Questions
Exam 7: Sampling Distributions162 Questions
Exam 8: Large-Sample Estimation173 Questions
Exam 9: Large-Sample Tests of Hypotheses210 Questions
Exam 10: Inference From Small Samples261 Questions
Exam 11: The Analysis of Variance156 Questions
Exam 12: Linear Regression and Correlation165 Questions
Exam 13: Multiple Regression Analysis178 Questions
Exam 14: Analysis of Categorical Data136 Questions
Exam 15: Nonparametric Statistics198 Questions
Select questions type
In the simple linear regression model, the slope represents:
(Multiple Choice)
4.9/5  (41)
(41)
The value of the sum of squares for regression SSR can never be larger than the value of sum of squares for error SSE.
(True/False)
4.9/5 (38)
An automobile company in Michigan is interested in the relationship between the gender of their employees and employee productivity. A good starting point in this analysis would be to compute the coefficient of determination and the correlation coefficient.
(True/False)
4.7/5 (29)
A regression analysis between sales (in $1000) and advertising (in $100) resulted in the following least squares line:  = 77 +8x. This implies that if advertising is $600, then the predicted amount of sales (in dollars) is $125,000.
(True/False)
4.8/5 (30)
In a simple linear regression model, if the regression model is statistically significant, then the regression slope coefficient is significantly greater than zero.
(True/False)
4.9/5 (30)
The sum of squares for regression (SSR) can never be larger than the sum of squares for error (SSE).
(True/False)
4.9/5 (35)
In order to predict with 80% confidence the expected value of y for a given value of x in a simple linear regression problem, a random sample of 15 observations is taken. Which of the following t-table values listed below would be used?
(Multiple Choice)
4.9/5 (36)
In a simple linear regression problem, the least squares line is  = 2.73 - 1.02x, and the coefficient of determination is 0.7744. The correlation coefficient must be -0.88.
(True/False)
4.7/5 (37)
Let x be the area (in square feet) to be covered with blacktop and let y be the time (in minutes) it takes a construction crew to completely cover the area. The simple linear regression model relates x and y where the least squares estimates of the regression parameters are b = 0.207 and a = 81.6.
What is the least-squares best-fitting regression line?  = ______________
What is the estimated amount of time it takes to apply 2400 square feet of blacktop?
______________ (minutes)
What is the average change in time per one square foot increase in area?
______________ (minutes)
= ______________
What is the estimated amount of time it takes to apply 2400 square feet of blacktop?
______________ (minutes)
What is the average change in time per one square foot increase in area?
______________ (minutes)
(Short Answer)
4.8/5 (32)
A regression analysis between weight (y in pounds) and height (x in inches) resulted in the following least squares line:  = 120 + 5x. This implies that if the height is increased by 1 inch, the weight, on average, is expected to:
(Multiple Choice)
4.8/5 (31)
In developing 90% prediction interval for the particular value of y from a simple linear regression problem involving a sample of size 14, the appropriate table value would be 2.179.
(True/False)
4.9/5 (35)
In simple linear regression analysis, if the correlation coefficient between the independent variable x and the dependent variable y is -.85, this means that the scatterplot generated by the same data values would show points that would fall on a straight line with slope equal to -.85.
(True/False)
4.9/5 (30)
A professor of economics wants to study the relationship between income (y in $1000s) and education (x in years). A random sample eight individuals is taken and the results are shown below.  Predict with 95% confidence the income of an individual with 10 years of education.
CI = ______________ Enter (n1, n2) in thousands
Estimate with 95% confidence the average income of all individuals with 10 years of education.
CI = ______________ Enter (n1, n2) in thousands
Which interval in the previous two questions is narrower: the confidence interval estimate of the expected value of y or the prediction interval for the same given value of x (10 years) and same confidence level?
______________
Why?
________________________________________________________
Predict with 95% confidence the income of an individual with 10 years of education.
CI = ______________ Enter (n1, n2) in thousands
Estimate with 95% confidence the average income of all individuals with 10 years of education.
CI = ______________ Enter (n1, n2) in thousands
Which interval in the previous two questions is narrower: the confidence interval estimate of the expected value of y or the prediction interval for the same given value of x (10 years) and same confidence level?
______________
Why?
________________________________________________________
(Essay)
4.8/5 (38)
In a simple linear regression problem, suppose the sum of squares for regression (SSR) is 90. Which of the following must be true?
(Multiple Choice)
4.8/5 (33)
A medical statistician wanted to examine the relationship between the amount of sunshine (x) in hours, and incidence of skin cancer (y). As an experiment he found the number of skin cancers detected per 100,000 of population and the average daily sunshine in eight counties around the country. These data are shown below.  Determine the least squares regression line.
  = ______________
Draw a scatter diagram of the data and plot the least squares regression line on it.
Estimate the number of skin cancer per 100,000 of population for 6 hours of sunshine.
______________
Calculate the residual corresponding to the pair (x, y) = (8, 15).
______________
= ______________
Draw a scatter diagram of the data and plot the least squares regression line on it.
Estimate the number of skin cancer per 100,000 of population for 6 hours of sunshine.
______________
Calculate the residual corresponding to the pair (x, y) = (8, 15).
______________
(Essay)
4.8/5 (27)
If the plot of the residuals is fan shaped, which assumption of regression analysis if violated?
(Multiple Choice)
4.9/5 (36)
In a simple linear regression analysis, it was stated that the correlation between starting salary and years of experience is 0.80. This indicates that 80% of the variation in starting salary is explained by years of experience.
(True/False)
4.7/5 (36)
A study was conduced to determine the effect of extra help sessions attended on students ability to avoid mistakes on a 20- multiple choice test. The data shown below represent the number of extra help sessions attended (x) and the average number of mistakes (y) recorded. 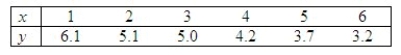 Use the regression formulas to find the least-squares line for the data.
  = ______________
Plot the six points and graph the line.
Does the line appear to provide a good fit to the data points?
______________
Use the least-Squares line to predict the value of y when x = 3.5.
______________
Do the data provide sufficient evidence to indicate that y and x are linearly related at the 1% level of significance?
p-value:
______________
Conclude:
______________
y and x ______________ linearly related.
Calculate the coefficient of determination.
r2 = ______________
What information does this value give about the usefulness of the linear model?
________________________________________________________
= ______________
Plot the six points and graph the line.
Does the line appear to provide a good fit to the data points?
______________
Use the least-Squares line to predict the value of y when x = 3.5.
______________
Do the data provide sufficient evidence to indicate that y and x are linearly related at the 1% level of significance?
p-value:
______________
Conclude:
______________
y and x ______________ linearly related.
Calculate the coefficient of determination.
r2 = ______________
What information does this value give about the usefulness of the linear model?
________________________________________________________
(Essay)
4.8/5 (30)
Given the least squares regression line  = -2.48 + 1.63x, and a coefficient of determination of 0.81, the coefficient of correlation is:
(Multiple Choice)
4.8/5 (31)
Filters
- Essay(0)
- Multiple Choice(0)
- Short Answer(0)
- True False(0)
- Matching(0)