Exam 2: Graphical and Tabular Descriptive Techniques
Exam 1: What Is Statistics41 Questions
Exam 2: Graphical and Tabular Descriptive Techniques199 Questions
Exam 3: Numerical Descriptive Techniques226 Questions
Exam 4: Data Collection and Sampling82 Questions
Exam 5: Probability212 Questions
Exam 6: Random Variables and Discrete Probability Distributions174 Questions
Exam 7: Continuous Probability Distributions167 Questions
Exam 8: Sampling Distributions133 Questions
Exam 9: Introduction to Estimation88 Questions
Exam 10: Introduction to Hypothesis Testing186 Questions
Exam 11: Inference About a Population76 Questions
Exam 12: Inference About Comparing Two Populat85 Questions
Exam 13: Inference About Comparing Two Populat85 Questions
Exam 14: Analysis of Variance127 Questions
Exam 15: Chi-Squared Tests118 Questions
Exam 16: Simple Linear Regression and Correlat238 Questions
Exam 17: Multiple Regression147 Questions
Exam 18: Review of Statistical Inference189 Questions
Select questions type
It is typical that when taking an exam, few students hand in their exams early; most prefer to reread their papers and hand them in near the end of the scheduled exam period. Under this scenario, a histogram of exam taking times is ____________________ skewed.
(Short Answer)
5.0/5  (35)
(35)
One of the variables used to help predict unemployment rates is the rate of inflation. Accordingly, we identify rate of inflation as the ____________________ variable, and unemployment rate as the ____________________ variable.
(Short Answer)
4.8/5 (35)
Electronics Company At a meeting of regional offices managers of a national electronics company, a survey was taken to determine the number of employees the regional managers supervise in the operation of their departments. The results of the survey are shown below. 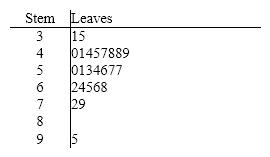 {Electronics Company Narrative} What is the cumulative relative frequency corresponding to 5 employees?
(Essay)
4.7/5 (32)
The sum of relative frequencies in a distribution always equals 1.
(True/False)
4.7/5 (36)
When one variable increases and the other decreases, we say that there is a(n)____________________ relationship between these two variables.
(Short Answer)
4.9/5 (41)
A relative frequency distribution lists the categories and their counts.
(True/False)
4.9/5 (31)
What does the length of each line of a stem-and-leaf display represent?
(Multiple Choice)
4.9/5 (43)
Can a scatter diagram be used to explore the relationship between two nominal variables? Explain why or why not.
(Essay)
4.9/5 (38)
If when one variable increases the other one also increases, we say that there is a(n)____________________ relationship between these two variables.
(Short Answer)
4.8/5 (35)
In a histogram, each observation is assigned to one or more classes.
(True/False)
5.0/5 (36)
One of the advantages of a pie chart is that it clearly shows that the total percentages of all the categories add to 100%.
(True/False)
4.9/5 (39)
{Test Grades Narrative} Construct a cumulative frequency and a cumulative relative frequency distribution for this data. What proportion of the exam scores are less than 60? What proportion of the exam scores are 70 or more?
(Essay)
4.7/5 (39)
For each of the following examples, identify the data type as nominal, ordinal, or interval.
a. The final grade received by a student in a neuro-science class.
b. The number of students in a Physics course.
c. The starting salary of a PhD graduate.
d. The size of an order of fries (small, medium, large, super-size)purchased by a Burger King customer.
e. The college you are enrolled in (Arts and Sciences, Business, Education, etc.).
(Essay)
4.9/5 (37)
When two variables are linearly related, and tend to move in opposite directions, we describe the nature of their association as a negative linear relationship.
(True/False)
4.9/5 (29)
A frequency distribution lists the categories and the proportion with which each occurs.
(True/False)
4.9/5 (41)
Filters
- Essay(0)
- Multiple Choice(0)
- Short Answer(0)
- True False(0)
- Matching(0)