Exam 2: Graphical and Tabular Descriptive Techniques
Exam 1: What Is Statistics41 Questions
Exam 2: Graphical and Tabular Descriptive Techniques199 Questions
Exam 3: Numerical Descriptive Techniques226 Questions
Exam 4: Data Collection and Sampling82 Questions
Exam 5: Probability212 Questions
Exam 6: Random Variables and Discrete Probability Distributions174 Questions
Exam 7: Continuous Probability Distributions167 Questions
Exam 8: Sampling Distributions133 Questions
Exam 9: Introduction to Estimation88 Questions
Exam 10: Introduction to Hypothesis Testing186 Questions
Exam 11: Inference About a Population76 Questions
Exam 12: Inference About Comparing Two Populat85 Questions
Exam 13: Inference About Comparing Two Populat85 Questions
Exam 14: Analysis of Variance127 Questions
Exam 15: Chi-Squared Tests118 Questions
Exam 16: Simple Linear Regression and Correlat238 Questions
Exam 17: Multiple Regression147 Questions
Exam 18: Review of Statistical Inference189 Questions
Select questions type
Electronics Company At a meeting of regional offices managers of a national electronics company, a survey was taken to determine the number of employees the regional managers supervise in the operation of their departments. The results of the survey are shown below. 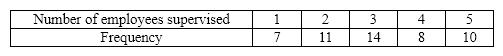 {Electronics Company Narrative} What proportion of managers supervise 3 employees?
(Essay)
4.9/5  (42)
(42)
{Teachers Ages Narrative} Draw a frequency histogram of this data which contains six classes. What is the shape of the histogram?
(Essay)
4.9/5 (28)
Suppose you measure the number of minutes it takes an employee to complete a task, where the maximum allowed time is 5 minutes, and each time is rounded to the nearest minute. Data from 130 employees is summarized below. Construct a frequency bar chart and a pie chart from this data. How long did it take most employees to complete the task? 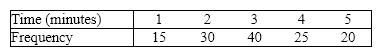
(Essay)
4.8/5 (33)
Observations that are measured at the same time are called ____________________ data.
(Short Answer)
4.9/5 (36)
For each of the following, indicate whether the variable of interest is nominal or interval.
a. Your marital status.
b. Whether you are a U.S. citizen.
c. Sally's travel time from her dorm to the student union on campus.
d. The amount of time you spent last week on your homework.
e. The number of cars parked in a certain parking lot at any given time.
f. Kate's favorite brand of sneakers.
(Essay)
4.8/5 (31)
Which of the following statements about pie charts is false?
(Multiple Choice)
4.8/5 (41)
A(n)____________________ is a graphical display consisting of a set of points, each point representing one variable measured along the horizontal axis, and another variable measured along the vertical axis.
(Short Answer)
4.9/5 (35)
Suppose you measure the number of minutes it takes an employee to complete a task, where the maximum allowed time is 5 minutes, and each time is rounded to the nearest minute. Data from 130 employees is summarized below. How long did it take most employees to complete the task? 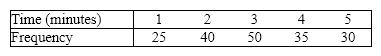
(Multiple Choice)
4.8/5 (36)
Internet Classes A survey of 25 students was conducted to determine how they rate the quality of Internet classes. Students were asked to rate the overall quality from 0 (no quality at all)to 100 (extremely good quality). The stem-and-leaf display of the data is shown below. 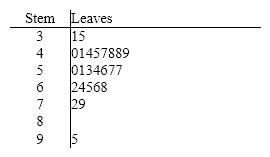 {Internet Classes Narrative} What percentage of the students rated the overall quality of Internet classes as being 60 or below?
(Essay)
5.0/5 (39)
A stem-and-leaf display reveals more information about the original data than does a histogram.
(True/False)
4.9/5 (33)
Car buyers were asked to indicate the car dealer they believed offered the best overall service. The four choices were Convoy Motors (C), Mako Chrysler (M), Torrent Auto (T), and Unequaled Chevrolet (U). The following data were obtained: 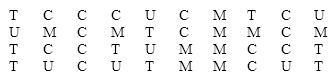 What percentage of car buyers identified Convoy Motors as having the best overall service?
(Multiple Choice)
4.8/5 (33)
Which situation identifies when to use pie charts and\or bar charts?
(Multiple Choice)
4.9/5 (37)
What are the two most important characteristics to look for in a scatter diagram?
(Essay)
4.9/5 (33)
The two most important characteristics revealed by the scatter diagram are the strength and direction of the linear relationship.
(True/False)
4.7/5 (44)
The largest value of a cumulative relative frequency is ____________________.
(Short Answer)
4.8/5 (43)
Filters
- Essay(0)
- Multiple Choice(0)
- Short Answer(0)
- True False(0)
- Matching(0)