Exam 2: Graphical and Tabular Descriptive Techniques
Exam 1: What Is Statistics41 Questions
Exam 2: Graphical and Tabular Descriptive Techniques199 Questions
Exam 3: Numerical Descriptive Techniques226 Questions
Exam 4: Data Collection and Sampling82 Questions
Exam 5: Probability212 Questions
Exam 6: Random Variables and Discrete Probability Distributions174 Questions
Exam 7: Continuous Probability Distributions167 Questions
Exam 8: Sampling Distributions133 Questions
Exam 9: Introduction to Estimation88 Questions
Exam 10: Introduction to Hypothesis Testing186 Questions
Exam 11: Inference About a Population76 Questions
Exam 12: Inference About Comparing Two Populat85 Questions
Exam 13: Inference About Comparing Two Populat85 Questions
Exam 14: Analysis of Variance127 Questions
Exam 15: Chi-Squared Tests118 Questions
Exam 16: Simple Linear Regression and Correlat238 Questions
Exam 17: Multiple Regression147 Questions
Exam 18: Review of Statistical Inference189 Questions
Select questions type
Which of the following is true about a stem-and-leaf display?
(Multiple Choice)
4.8/5  (35)
(35)
Consider the following cumulative frequency distribution. 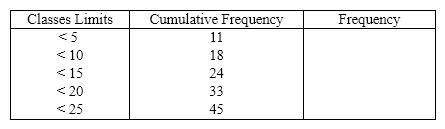 Fill in the frequencies for each class in the above table.
(Essay)
4.8/5 (40)
The Chief of Police conducted a survey of the officers on his squad. An officer's shooting score at target practice is an example of a(n)____________________ variable.
(Short Answer)
4.9/5 (39)
A(n)____________________ histogram is one with a long tail extending to either the right or the left.
(Short Answer)
4.8/5 (33)
Briefly discuss the difference between cross-sectional data and time-series data.
(Essay)
4.8/5 (35)
The line chart below shows cucumber prices fluctuated from $2.00 per pound to over $4.50 per pound during the year. 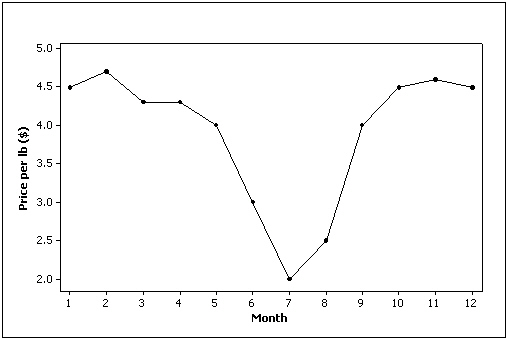
(True/False)
4.8/5 (34)
According to the stem-and-leaf plot below, this data set has a negative median. 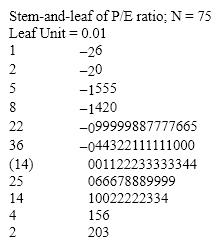
(True/False)
4.9/5 (41)
Beef prices throughout the year (month 1 = January)are shown in the line chart below (per pound). Describe beef prices for this given year using this line chart. 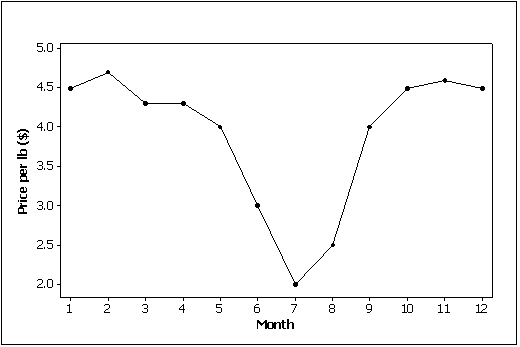
(Essay)
4.7/5 (38)
A histogram is said to be ____________________ if, when we draw a vertical line down the center of the histogram, the two sides are identical in shape and size.
(Short Answer)
4.7/5 (38)
A(n)____________________ chart is often used to display frequencies; a(n)____________________ chart graphically shows relative frequencies.
(Short Answer)
4.7/5 (39)
We can summarize nominal data in a table that presents the categories and their counts. This table is called a(n)____________________ distribution.
(Short Answer)
4.9/5 (32)
A professor examines the relationship between minutes studying and exam score (out of 200 points)for a random sample of his students. The scatter diagram is shown below. It appears that study time has somewhat of a positive linear relationship with exam score. 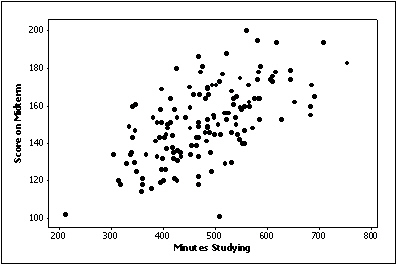
(True/False)
4.9/5 (35)
At the end of a safari, the tour guide asks the vacationers to respond to the questions listed below. For each question, determine whether the possible responses are interval, nominal, or ordinal.
a. How many safaris have you taken prior to this one?
b. Do you feel that your tour safari lasted sufficiently long (yes\no)?
c. Which of the following features of the accommodations did you find most attractive: location, facilities, room size, service, or price?
d. What is the maximum number of hours per day that you would like to spend traveling?
e. Is your overall rating of this safari: excellent, good, fair, or poor?
(Essay)
4.9/5 (31)
In order to draw a scatter diagram, we need interval data for
(Multiple Choice)
4.9/5 (37)
Twenty-five voters participating in a recent election exit poll in Minnesota were asked to state their political party affiliation. Coding the data as R for Republican, D for Democrat, and I for Independent, the data collected were as follows: I, R, D, I, R, I, I, D, R, I, I, D, R, R, I, D, I, R, I, D, I, D, R, R, and I. Construct a frequency bar chart from this data. What does the bar chart tell you about the political affiliations of those in this sample?
(Essay)
4.8/5 (32)
Which of the following statements about shapes of histograms is true?
(Multiple Choice)
4.8/5 (43)
Filters
- Essay(0)
- Multiple Choice(0)
- Short Answer(0)
- True False(0)
- Matching(0)