Exam 2: Graphical and Tabular Descriptive Techniques
Exam 1: What Is Statistics41 Questions
Exam 2: Graphical and Tabular Descriptive Techniques199 Questions
Exam 3: Numerical Descriptive Techniques226 Questions
Exam 4: Data Collection and Sampling82 Questions
Exam 5: Probability212 Questions
Exam 6: Random Variables and Discrete Probability Distributions174 Questions
Exam 7: Continuous Probability Distributions167 Questions
Exam 8: Sampling Distributions133 Questions
Exam 9: Introduction to Estimation88 Questions
Exam 10: Introduction to Hypothesis Testing186 Questions
Exam 11: Inference About a Population76 Questions
Exam 12: Inference About Comparing Two Populat85 Questions
Exam 13: Inference About Comparing Two Populat85 Questions
Exam 14: Analysis of Variance127 Questions
Exam 15: Chi-Squared Tests118 Questions
Exam 16: Simple Linear Regression and Correlat238 Questions
Exam 17: Multiple Regression147 Questions
Exam 18: Review of Statistical Inference189 Questions
Select questions type
In applications involving two variables, X and Y , where one variable depends to some degree on the other, we call Y the ____________________ variable.
(Short Answer)
4.9/5  (38)
(38)
Observations that are taken during successive points in time are called ____________________ data.
(Short Answer)
4.9/5 (45)
Test Grades The scores on a calculus test for a random sample of 40 students are as follows: 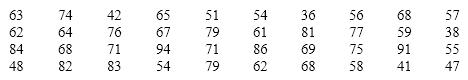 {Test Grades Narrative} Construct a stem-and-leaf display for this data set. Describe the shape of the data.
(Essay)
4.8/5 (31)
The graphical technique used to describe the relationship between two interval variables is the scatter diagram.
(True/False)
4.8/5 (36)
It is speculated that the number of police officers has a negative linear relationship with number of crimes. Explain why this might be so.
(Essay)
4.9/5 (29)
Time series data are often graphically depicted on a line chart, which is a plot of the variable of interest over time.
(True/False)
4.8/5 (35)
The final grade received in a Literature course (A, B, C, D, or F)is an example of a(n)____________________ variable.
(Short Answer)
4.7/5 (39)
A(n)____________________ is created by plotting the value of the variable on the vertical axis and the time periods on the horizontal axis.
(Short Answer)
4.9/5 (27)
Which of the following statements about histograms is false?
(Multiple Choice)
4.9/5 (44)
Provide one example of ordinal data; one example of nominal data; and one example of interval data.
(Essay)
4.8/5 (33)
An economics professor wants to study the relationship between income and education. A sample of 10 individuals is selected at random, and their income (in thousands of dollars)and education (in years)are shown below:  a. Draw a scatter diagram for these data with the income on the vertical axis.
b. Describe the relationship between income and education.
a. Draw a scatter diagram for these data with the income on the vertical axis.
b. Describe the relationship between income and education.
(Essay)
4.9/5 (42)
In a histogram a(n)____________________ class is the one with the largest number of observations.
(Short Answer)
5.0/5 (35)
Internet Classes A survey of 25 students was conducted to determine how they rate the quality of Internet classes. Students were asked to rate the overall quality from 0 (no quality at all)to 100 (extremely good quality). The stem-and-leaf display of the data is shown below.
Stem Leaves
3 15
4 01457889
5 0134677
6 24568
7 29
8
9 5
{Internet Classes Narrative} What percentage of the students rated the overall quality of Internet classes as being 70 or above?
(Essay)
4.8/5 (32)
A supermarket's monthly sales (in thousands of dollars)for the last year were as follows: 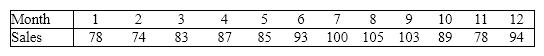 Construct a relative frequency bar chart for this data set. How many observations are there in this data set?
(Essay)
4.8/5 (31)
In purchasing an automobile, there are a number of variables to consider. The body style of the car (sedan, coupe, wagon, etc.)is an example of a(n)____________________ variable.
(Short Answer)
4.9/5 (25)
The relationship between two interval variables is graphically displayed by a
(Multiple Choice)
4.8/5 (32)
Filters
- Essay(0)
- Multiple Choice(0)
- Short Answer(0)
- True False(0)
- Matching(0)