Exam 2: Graphical and Tabular Descriptive Techniques
Exam 1: What Is Statistics41 Questions
Exam 2: Graphical and Tabular Descriptive Techniques199 Questions
Exam 3: Numerical Descriptive Techniques226 Questions
Exam 4: Data Collection and Sampling82 Questions
Exam 5: Probability212 Questions
Exam 6: Random Variables and Discrete Probability Distributions174 Questions
Exam 7: Continuous Probability Distributions167 Questions
Exam 8: Sampling Distributions133 Questions
Exam 9: Introduction to Estimation88 Questions
Exam 10: Introduction to Hypothesis Testing186 Questions
Exam 11: Inference About a Population76 Questions
Exam 12: Inference About Comparing Two Populat85 Questions
Exam 13: Inference About Comparing Two Populat85 Questions
Exam 14: Analysis of Variance127 Questions
Exam 15: Chi-Squared Tests118 Questions
Exam 16: Simple Linear Regression and Correlat238 Questions
Exam 17: Multiple Regression147 Questions
Exam 18: Review of Statistical Inference189 Questions
Select questions type
Insurance Company A representative from a local insurance agency selected a random sample of insured homeowners and recorded the number of claims made in the last three years, with the following results: 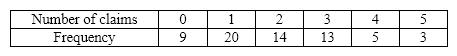 {Insurance Company Narrative} How many total claims are represented in the sample?
(Essay)
4.9/5  (34)
(34)
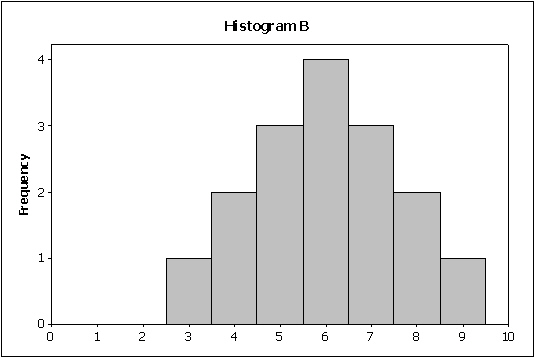
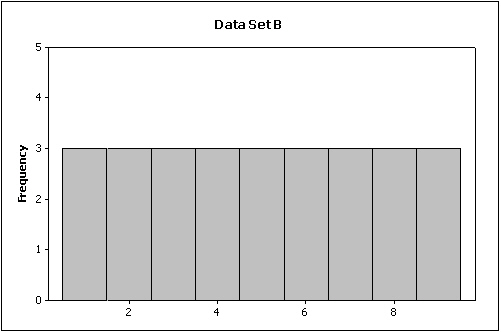
Compare the two histograms below. Which statement is true? 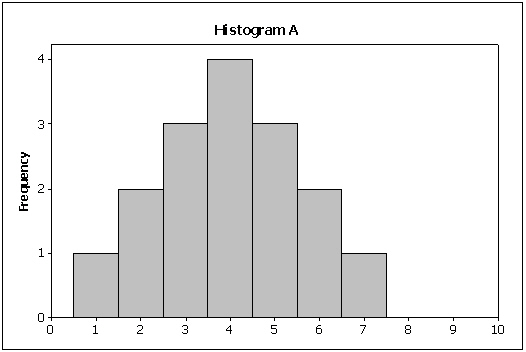
(Multiple Choice)
4.8/5 (37)
Which of the following statements describe(s)the line chart below? 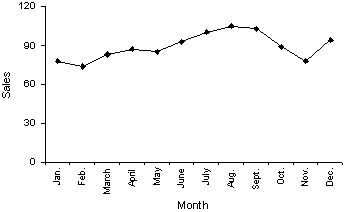
(Multiple Choice)
4.9/5 (39)
{Business School Graduates Narrative} If you were only given the frequency bar chart below, would you able to reconstruct the original observations in the data set? 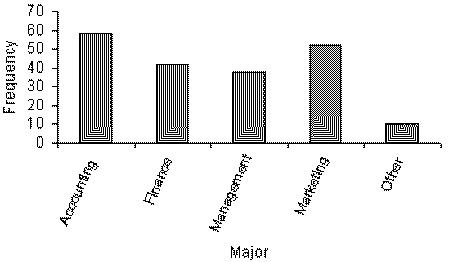
(Essay)
4.8/5 (40)
Compare the spread of the two histograms below. Which of the following is true? 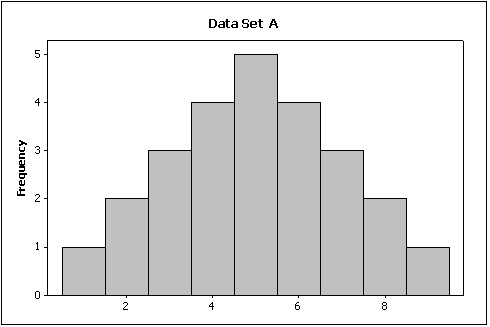
(Multiple Choice)
4.9/5 (38)
{Test Grade Narrative} Construct a relative frequency histogram for this data set and discuss its shape.
(Essay)
4.8/5 (36)
The scatter diagram below depicts data with a negative linear relationship. 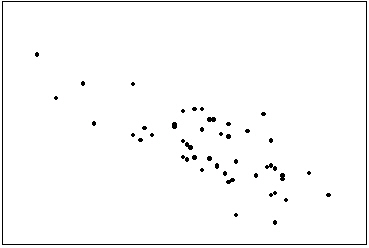
(True/False)
4.8/5 (39)
Internet Classes A survey of 25 students was conducted to determine how they rate the quality of Internet classes. Students were asked to rate the overall quality from 0 (no quality at all)to 100 (extremely good quality). The stem-and-leaf display of the data is shown below. 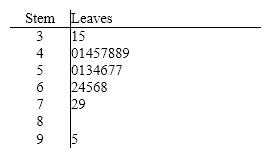 {Internet Classes Narrative} What percentage of the students rated the overall quality of on-line classes as being below 40?
(Essay)
4.8/5 (30)
The number of class intervals in a histogram depends on the number of observations in the data set.
(True/False)
4.9/5 (34)
The two most important characteristics to look for in a scatter diagram are the ____________________ and ____________________ of the linear relationship.
(Short Answer)
4.7/5 (44)
A researcher wishes to estimate the textbook costs of first-year students at Barry University. To do so, he recorded the textbook cost of 300 first-year students and found that their average textbook cost was $195 per semester. The variable of interest to the researcher is
(Multiple Choice)
4.9/5 (34)
The relative frequency of a class in a histogram is computed by
(Multiple Choice)
4.8/5 (35)
When two variables tend to move in opposite directions, yet still form a linear pattern, how do you describe their relationship?
(Multiple Choice)
4.9/5 (32)
The length of each line in a step-and-leaf display represents the ____________________ of that class interval defined by the stems.
(Short Answer)
4.8/5 (35)
In purchasing a used computer, there are a number of variables to consider. The age of the computer is an example of a(n)____________________ variable.
(Short Answer)
4.8/5 (35)
A skewed histogram is one with a long tail extending either to the right or left.
(True/False)
4.9/5 (36)
An individual's income depends somewhat on their number of years of education. Accordingly, we identify income as the ____________________ variable, and years of education as the ____________________ variable.
(Short Answer)
4.8/5 (30)
Filters
- Essay(0)
- Multiple Choice(0)
- Short Answer(0)
- True False(0)
- Matching(0)