Exam 2: Graphical and Tabular Descriptive Techniques
Exam 1: What Is Statistics41 Questions
Exam 2: Graphical and Tabular Descriptive Techniques199 Questions
Exam 3: Numerical Descriptive Techniques226 Questions
Exam 4: Data Collection and Sampling82 Questions
Exam 5: Probability212 Questions
Exam 6: Random Variables and Discrete Probability Distributions174 Questions
Exam 7: Continuous Probability Distributions167 Questions
Exam 8: Sampling Distributions133 Questions
Exam 9: Introduction to Estimation88 Questions
Exam 10: Introduction to Hypothesis Testing186 Questions
Exam 11: Inference About a Population76 Questions
Exam 12: Inference About Comparing Two Populat85 Questions
Exam 13: Inference About Comparing Two Populat85 Questions
Exam 14: Analysis of Variance127 Questions
Exam 15: Chi-Squared Tests118 Questions
Exam 16: Simple Linear Regression and Correlat238 Questions
Exam 17: Multiple Regression147 Questions
Exam 18: Review of Statistical Inference189 Questions
Select questions type
In applications involving two variables, X and Y , where one variable depends to some degree on the other, we call X the ____________________ variable.
(Short Answer)
5.0/5  (32)
(32)
{Test Grades Narrative} Construct frequency and relative frequency distributions for this data set using seven class intervals. Describe the shape of the data set.
(Essay)
4.8/5 (31)
Twenty-five voters participating in a recent election exit poll in Alabama were asked to state their political party affiliation. Coding the data 1 for Republican, 2 for Democrat, and 3 for Independent, the data collected were as follows: 3, 1, 2, 3, 1, 3, 3, 2, 1, 3, 3, 2, 1, 1, 3, 2, 3, 1, 3, 2, 3, 2, 1, 1, 3, 1, 2, 2, 1, and 3. Develop a frequency distribution and a relative frequency distribution for this data. What does the data suggest about the strength of the political parties in Alabama?
(Essay)
4.7/5 (27)
How do you determine whether two interval variables have a positive linear relationship?
(Multiple Choice)
4.9/5 (28)
Car Buyers Forty car buyers were asked to indicate which car dealer offered the best overall service. The four choices were Contour Motors (C), Modern Chrysler (M), Tonneau Auto (T), and Uncanny Chevrolet (U). The following data were obtained: 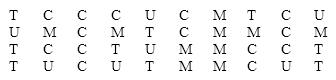 {Car Buyers Narrative} Construct a frequency bar chart of this data. Which car dealer came in last place in terms of overall service?
(Essay)
4.7/5 (23)
The Dean of Students conducted a survey on campus. Class rank (Freshman, Sophomore, Junior, and Senior)is an example of a(n)____________________ variable.
(Short Answer)
4.7/5 (38)
A(n)____________________ display shows the actual observations as well as the number of observations in each class.
(Short Answer)
4.8/5 (43)
Which of the following statements about histograms is false?
(Multiple Choice)
4.9/5 (36)
The number of observations within each class may be found in a frequency distribution.
(True/False)
4.7/5 (40)
A relative frequency distribution describes the proportion of data values that fall within each category.
(True/False)
4.9/5 (44)
A(n)____________________ chart is not able to show frequencies. It can only show relative frequencies.
(Short Answer)
4.8/5 (30)
Observations that are measured at successive points in time is what type of data?
(Multiple Choice)
4.9/5 (32)
Your age group (1-9; 10-19; 20-29; 30-39; etc.)is an interval variable.
(True/False)
4.7/5 (23)
Whether or not you are over the age of 21 is a nominal variable.
(True/False)
4.9/5 (32)
Two types of graphs that organize nominal data are ____________________ and ____________________.
(Short Answer)
4.8/5 (39)
Which of the following describes a positive linear relationship between X and Y ?
(Multiple Choice)
4.9/5 (37)
A category in a pie chart that contains 50% of the observations is represented by a slice of the pie that is equal to ____________________ degrees.
(Short Answer)
4.8/5 (36)
Filters
- Essay(0)
- Multiple Choice(0)
- Short Answer(0)
- True False(0)
- Matching(0)