Exam 2: Displaying and Describing Categorical Data
Exam 1: Data30 Questions
Exam 2: Displaying and Describing Categorical Data65 Questions
Exam 3: Displaying and Summarizing Quantitative Data93 Questions
Exam 4: Understanding and Comparing Distributions102 Questions
Exam 5: The Standard Deviation As a Ruler and the Normal Model131 Questions
Exam 6: Scatterplots, association, and Correlation74 Questions
Exam 7: Linear Regression57 Questions
Exam 8: Regression Wisdom32 Questions
Exam 9: Re-Expressing Data: Get It Straight51 Questions
Exam 10: Understanding Randomness26 Questions
Exam 11: Sample Surveys50 Questions
Exam 12: Experiments and Observational Surveys87 Questions
Exam 13: From Randomness to Probability64 Questions
Exam 14: Probability Rules90 Questions
Exam 15: Random Variables112 Questions
Exam 16: Probability Models114 Questions
Exam 17: Sampling Distribution Models45 Questions
Exam 18: Confidence Intervals for Proportions56 Questions
Exam 19: Testing Hypotheses About Proportions50 Questions
Exam 20: More About Tests69 Questions
Exam 21: Comparing Two Proportions52 Questions
Exam 22: Inferences About Means106 Questions
Exam 23: Comparing Means43 Questions
Exam 24: Paired Samples and Blocks33 Questions
Exam 25: Comparing Counts78 Questions
Exam 26: Inferences for Regression51 Questions
Exam 27: Analysis of Variance39 Questions
Exam 28: Multifactor Analysis of Variance22 Questions
Exam 29: Multiple Regression22 Questions
Exam 30: Multiple Regression Wisdom21 Questions
Exam 31: Rank-Based Nonparametric Tests29 Questions
Exam 32: The Bootstrap31 Questions
Select questions type
A survey of salesmen was conducted to examine the possibility of a relationship between men's height and annual income.The company interested in the results of the survey believes that taller men are more successful at getting sales,resulting in a higher annual income.The table shows the percentages of income levels for each height category.A graphical display of the conditional distributions of income levels by height is given. 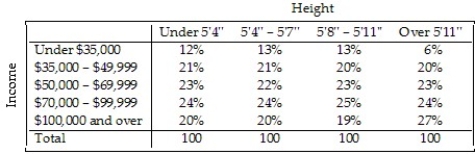
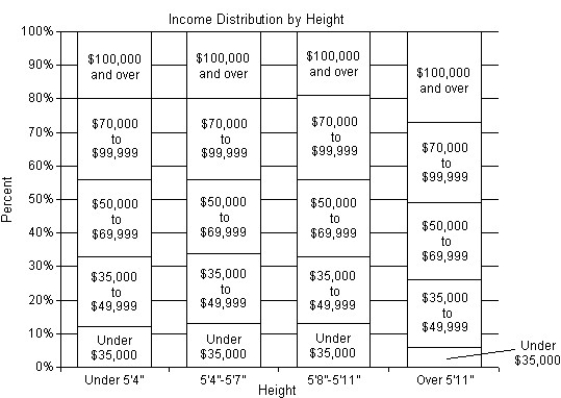 Do these data support the company's belief: taller men are more successful salesmen? Explain.
(Multiple Choice)
4.8/5  (43)
(43)
Most women who have had a mastectomy can have breast reconstruction surgery.The reconstruction surgery can be performed at the same time as the mastectomy,an immediate reconstruction,or after the patient has healed from the mastectomy,second surgery reconstruction.Some women opt not to have reconstruction surgery.The table shows the percentages of women's choices regarding reconstruction for three age categories.A graphical display of the conditional distributions of reconstruction choice by age is given. 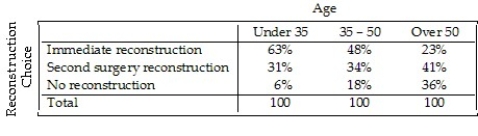
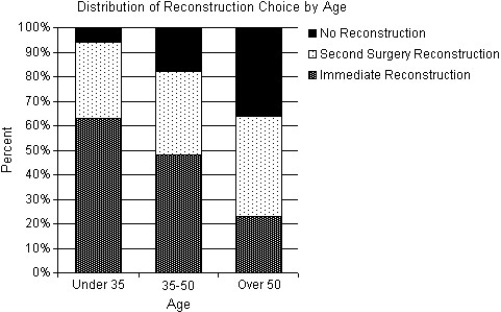 Does there appear to be an association between reconstruction choice and age? Explain.
(Multiple Choice)
4.9/5 (37)
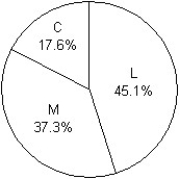
Students in a Political Science course were asked to describe their politics as "Liberal","Moderate",or "Conservative." Here are the results: 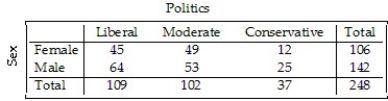 Which graphical display shows the conditional distribution of politics among the males?
I II
Which graphical display shows the conditional distribution of politics among the males?
I II 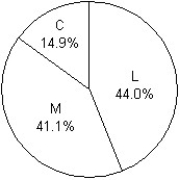
 III
III 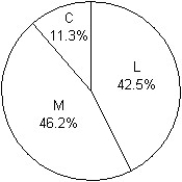
(Multiple Choice)
4.8/5 (31)
A newspaper surveyed its subscribers as to which section of the paper they read first.The results are listed below. 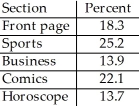 What percent of subscribers read a section of the paper not listed above first?
(Multiple Choice)
4.9/5 (34)
The Centers for Disease Control in the U.S.A.lists causes of death for individual states in 2002.The mortality data for one state is given. 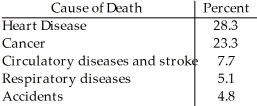 Which of the following displays is/are appropriate for these data? (More than one display may be appropriate. )
I II
Which of the following displays is/are appropriate for these data? (More than one display may be appropriate. )
I II 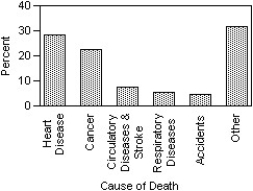
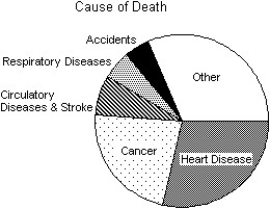 III
III 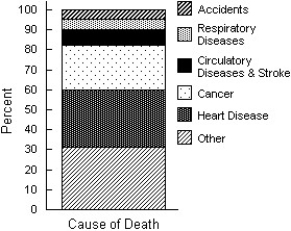
(Multiple Choice)
4.8/5 (26)
Filters
- Essay(0)
- Multiple Choice(0)
- Short Answer(0)
- True False(0)
- Matching(0)