Exam 2: Displaying and Describing Categorical Data
Exam 1: Data30 Questions
Exam 2: Displaying and Describing Categorical Data65 Questions
Exam 3: Displaying and Summarizing Quantitative Data93 Questions
Exam 4: Understanding and Comparing Distributions102 Questions
Exam 5: The Standard Deviation As a Ruler and the Normal Model131 Questions
Exam 6: Scatterplots, association, and Correlation74 Questions
Exam 7: Linear Regression57 Questions
Exam 8: Regression Wisdom32 Questions
Exam 9: Re-Expressing Data: Get It Straight51 Questions
Exam 10: Understanding Randomness26 Questions
Exam 11: Sample Surveys50 Questions
Exam 12: Experiments and Observational Surveys87 Questions
Exam 13: From Randomness to Probability64 Questions
Exam 14: Probability Rules90 Questions
Exam 15: Random Variables112 Questions
Exam 16: Probability Models114 Questions
Exam 17: Sampling Distribution Models45 Questions
Exam 18: Confidence Intervals for Proportions56 Questions
Exam 19: Testing Hypotheses About Proportions50 Questions
Exam 20: More About Tests69 Questions
Exam 21: Comparing Two Proportions52 Questions
Exam 22: Inferences About Means106 Questions
Exam 23: Comparing Means43 Questions
Exam 24: Paired Samples and Blocks33 Questions
Exam 25: Comparing Counts78 Questions
Exam 26: Inferences for Regression51 Questions
Exam 27: Analysis of Variance39 Questions
Exam 28: Multifactor Analysis of Variance22 Questions
Exam 29: Multiple Regression22 Questions
Exam 30: Multiple Regression Wisdom21 Questions
Exam 31: Rank-Based Nonparametric Tests29 Questions
Exam 32: The Bootstrap31 Questions
Select questions type
A survey of automobiles parked in student and staff lots at a large university classified the brands by country of origin,as seen in the table. 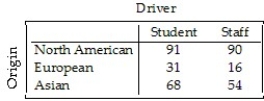 What is the marginal distribution of origin?
(Multiple Choice)
4.8/5  (39)
(39)
A college examined the impact of an applicant's ethnicity on the likelihood of admission to a particular program.The data are summarized in the table below. 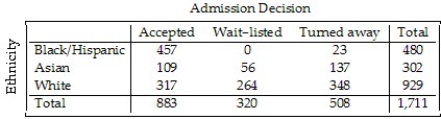 What percent of Asians were wait-listed?
(Multiple Choice)
4.7/5 (43)
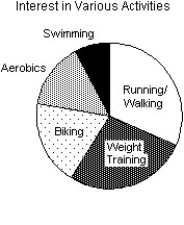
The City of Windsor Department of Parks and Recreation is planning to build a recreation centre in one of the city's parks.They conducted a poll to find out the types of physical activities the local population would be interested in.The poll was based on telephone responses from 1013 randomly selected adults.The table shows the percentages of people who expressed interest in various activities.  Which of the following displays is/are appropriate for these data? (More than one display may be appropriate. )
I II
Which of the following displays is/are appropriate for these data? (More than one display may be appropriate. )
I II 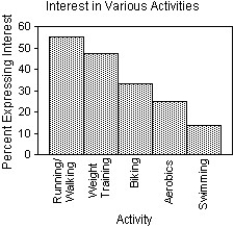
 III
III 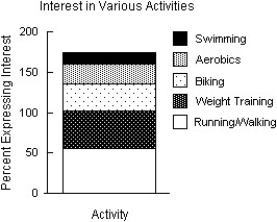
(Multiple Choice)
4.8/5 (35)
Most patients who undergo surgery make routine recoveries and are discharged as planned,but some patients experience complications and their discharge is delayed.A small city has a large hospital and a small hospital,each performing major and minor surgeries.Data is collected at each hospital to see how many surgical patients have their discharges delayed by postsurgical complications.The results are shown in the following table. 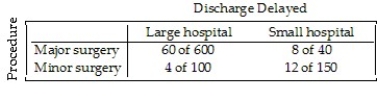 Overall,for what percent of surgical patients was discharge delayed?
(Multiple Choice)
4.9/5 (28)
Just how accurate are the weather forecasts we hear every day? The table below compares the daily forecast with a city's actual weather for a year. 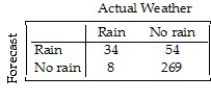 On what percent of days was rain predicted?
(Multiple Choice)
4.8/5 (37)
A real estate company kept a database on the apartments in a certain city.The percentages of various types of apartments are listed below. 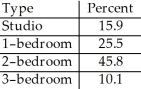 What percentage of the apartments in the city are 1-bedroom or 2-bedroom apartments?
(Multiple Choice)
4.8/5 (37)
The City of Windsor Department of Parks and Recreation is planning to build a recreation centre in one of the city's parks.They conducted a poll to find out the types of physical activities the local population would be interested in.The poll was based on telephone responses from 1013 randomly selected adults.The table shows the percentages of people who expressed interest in various activities. 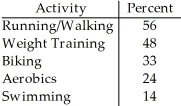 Which of the following displays is/are appropriate for these data? (More than one display may be appropriate. )
I II
Which of the following displays is/are appropriate for these data? (More than one display may be appropriate. )
I II 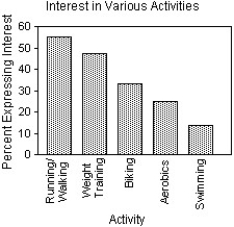
 III
III 
(Multiple Choice)
4.9/5 (35)
A survey of automobiles parked in student and staff lots at a large university classified the brands by country of origin,as seen in the table. 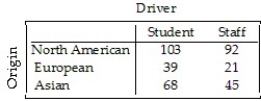 What is the conditional distribution of origin for staff?
(Multiple Choice)
4.8/5 (28)
A company held a cholesterol screening clinic for its employees.The results are summarized in the table below by age group and cholesterol level. 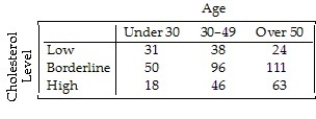 Create a segmented bar graph which shows the conditional distributions of cholesterol levels for each age group.
(Essay)
4.9/5 (20)
Most patients who undergo surgery make routine recoveries and are discharged as planned,but some patients experience complications and their discharge is delayed.A small city has a large hospital and a small hospital,each performing major and minor surgeries.Data is collected at each hospital to see how many surgical patients have their discharges delayed by postsurgical complications.The results are shown in the following table. 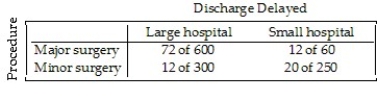 What were the discharge delay rates at each hospital?
(Multiple Choice)
4.8/5 (39)
Of the 1,606 applicants to a college program,456 were Black or Hispanic,300 were Asian,and 850 were White.Summarize the relative frequency distribution of ethnicity with a sentence or two in the proper context.
(Multiple Choice)
4.9/5 (39)
Statistics Canada gives the following mortality data for Canada in 2007. 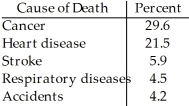 Is it reasonable to conclude that cancer or accidents were the cause of approximately 33.8% of deaths in 2002?
(Multiple Choice)
4.8/5 (34)
The table compares what students at a Canadian college did after graduating in 1992,1998,and 2003. 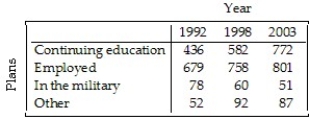 Create a segmented bar graph which shows the conditional distributions of plans for each of the three years.
(Essay)
4.9/5 (42)
The focus of a recent survey was was on teenagers' familiarity with and use of modern technology.The teenagers were asked if they used each of the following technologies on a daily basis and if the technology was critically important to own.For each question,the percentage of those responding "Yes" is given.Subtracting the "Use daily" percentage from the "Critically important to own" percentage gives the "Importance Gap." Here are the results: 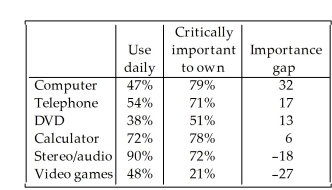 Create a bar chart for the "Importance Gap".
(Essay)
4.7/5 (40)
The Centers for Disease Control in the U.S.A.lists causes of death for individual states in 2002.The mortality data for one state is given. 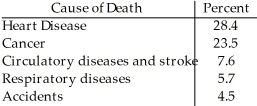 Which of the following displays is/are appropriate for these data? (More than one display may be appropriate. )
I II
Which of the following displays is/are appropriate for these data? (More than one display may be appropriate. )
I II 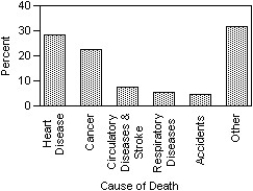
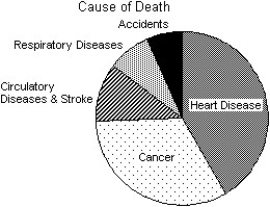 III
III 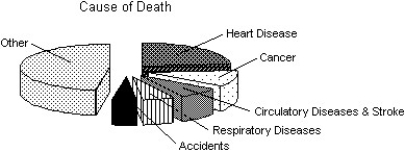
(Multiple Choice)
4.9/5 (29)
A survey of automobiles parked in student and staff lots at a large university classified the brands by country of origin,as seen in the table. 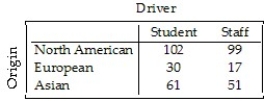 What percent of all the cars surveyed were foreign?
(Multiple Choice)
4.8/5 (36)
A survey of automobiles parked in student and staff lots at a large university classified the brands by country of origin.The results are listed in the table below. 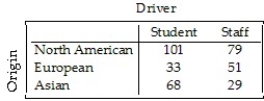 Create a segmented bar graph which shows the conditional distributions of origin for both students and staff.
(Essay)
4.8/5 (37)
The table below compares what students at a small Canadian college did after graduating with a bachelor's degree in 1992,1998,and 2003.A graphical display of the conditional distributions of what students did after graduation by year is given. 
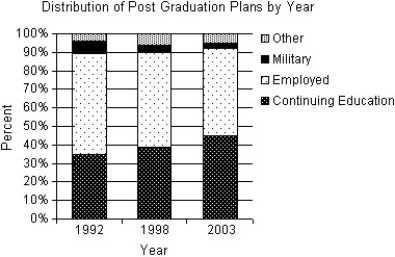 Does this study present any evidence that postgraduation plans have changed over this 11-year period? Explain.
(Multiple Choice)
4.8/5 (34)
Students in a Political Science course were asked to describe their politics as "Liberal","Moderate",or "Conservative." The results are listed in the table below. 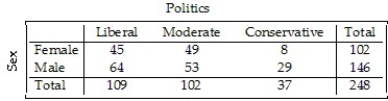 Create a segmented bar graph which shows the conditional distributions by gender for each political category.
(Essay)
4.8/5 (30)
A company held a blood pressure screening clinic for its employees.The results are summarized in the table below by age group and blood pressure level. 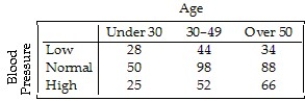 Find the conditional distribution of blood pressure level for employees under 30.
(Multiple Choice)
4.9/5 (33)
Filters
- Essay(0)
- Multiple Choice(0)
- Short Answer(0)
- True False(0)
- Matching(0)