Exam 6: Scatterplots, association, and Correlation
Exam 1: Data30 Questions
Exam 2: Displaying and Describing Categorical Data65 Questions
Exam 3: Displaying and Summarizing Quantitative Data93 Questions
Exam 4: Understanding and Comparing Distributions102 Questions
Exam 5: The Standard Deviation As a Ruler and the Normal Model131 Questions
Exam 6: Scatterplots, association, and Correlation74 Questions
Exam 7: Linear Regression57 Questions
Exam 8: Regression Wisdom32 Questions
Exam 9: Re-Expressing Data: Get It Straight51 Questions
Exam 10: Understanding Randomness26 Questions
Exam 11: Sample Surveys50 Questions
Exam 12: Experiments and Observational Surveys87 Questions
Exam 13: From Randomness to Probability64 Questions
Exam 14: Probability Rules90 Questions
Exam 15: Random Variables112 Questions
Exam 16: Probability Models114 Questions
Exam 17: Sampling Distribution Models45 Questions
Exam 18: Confidence Intervals for Proportions56 Questions
Exam 19: Testing Hypotheses About Proportions50 Questions
Exam 20: More About Tests69 Questions
Exam 21: Comparing Two Proportions52 Questions
Exam 22: Inferences About Means106 Questions
Exam 23: Comparing Means43 Questions
Exam 24: Paired Samples and Blocks33 Questions
Exam 25: Comparing Counts78 Questions
Exam 26: Inferences for Regression51 Questions
Exam 27: Analysis of Variance39 Questions
Exam 28: Multifactor Analysis of Variance22 Questions
Exam 29: Multiple Regression22 Questions
Exam 30: Multiple Regression Wisdom21 Questions
Exam 31: Rank-Based Nonparametric Tests29 Questions
Exam 32: The Bootstrap31 Questions
Select questions type
Soda is often considered unhealthy because its content is high in both caffeine and refined sugar.But are the two related? Caffeine and refined sugar contents (in milligrams)of 12 ounces of several brands of soda are shown on the following scatterplot.The correlation between caffeine and refined sugar is 0.189.Describe the association. 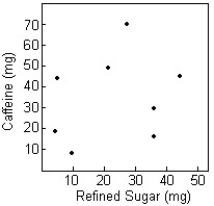
(Multiple Choice)
4.8/5  (46)
(46)
In a school,a scientist observed children during lunch time over several months to study how much they eat and for how many minutes.He evaluated in calories what each child ate each day for lunch.After careful observations,he found that the variables time and calories relate linearly,and that the correlation between those variables is 0.629.Suppose he was to record time in hours rather than in minutes.Would the correlation change?
(Multiple Choice)
4.8/5 (26)
A ceramics factory can fire seven large batches of pottery per day.Sometimes in the process a few of the pieces break.In order to understand the problem better,the factory records the number of broken pieces in each batch for 3 days and then creates the scatterplot shown.Make a histogram showing the distribution of the number of broken pieces in the 21 batches of pottery examined. 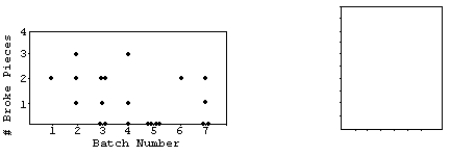
(Essay)
4.7/5 (31)
Several scatterplots are given with calculated correlations. Which is which?
-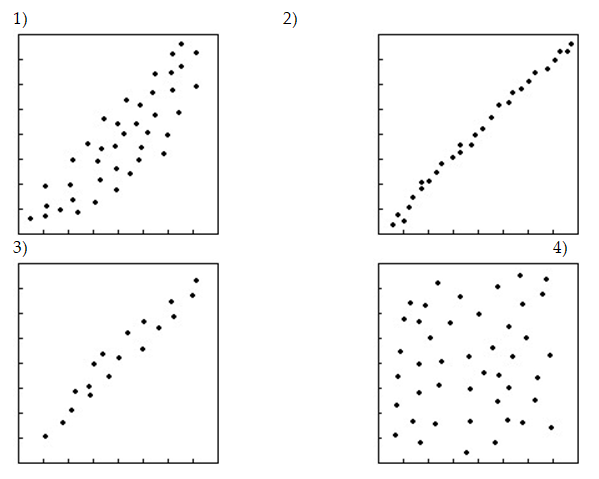 a)0.027,b)0.912,c)0.821,d)0.672
(Multiple Choice)
4.9/5 (29)
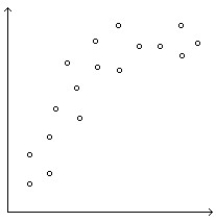
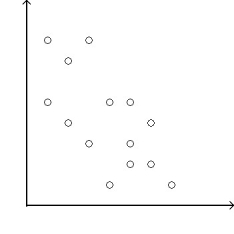
Determine whether the scatterplot shows little or no association, a negative association, a linear association, a moderately strong association, or a very strong association (multiple associations are possible).
-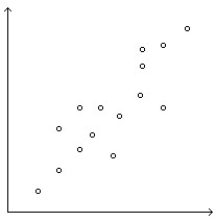
(Multiple Choice)
4.7/5 (41)
A clothes shop owner tries to predict the winter collection sales by displaying the coats sales (in dollars)and the outside temperature (in degrees Fahrenheit)on the following scatterplot.He calculates that the correlation between coats sales and temperature is -0.737.Suppose the variable temperature is recorded in degrees Celsius rather than in degrees Fahrenheit.What will be the correlation? 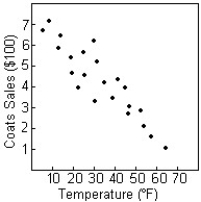
(Multiple Choice)
4.8/5 (34)
The table contains the weights (in kg)and heights (in cm)of 9 randomly selected adults. 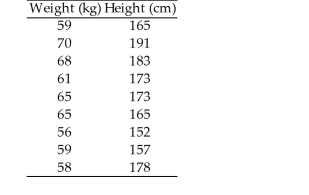
(Essay)
4.7/5 (38)
The paired data below consist of the test scores of 6 randomly selected students and the number of hours they studied for the test. 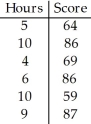
(Multiple Choice)
4.8/5 (38)
Determine whether the scatterplot shows little or no association, a negative association, a linear association, a moderately strong association, or a very strong association (multiple associations are possible).
-
(Multiple Choice)
4.8/5 (38)
A researcher studies children in elementary school and finds a strong positive linear association between shoe size and reading skills.Find the lurking variable,if there is one.
(Multiple Choice)
4.8/5 (23)
Several scatterplots are given with calculated correlations. Which is which?
-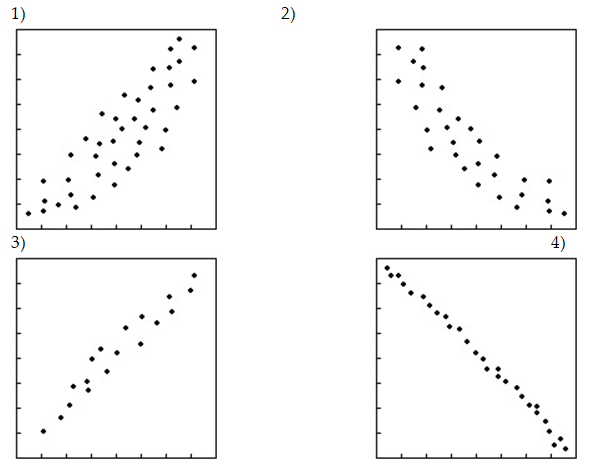 a)0.625,b)-0.775,c)-0.957,d)0.855
(Multiple Choice)
4.9/5 (36)
A study is conducted on insects growth based on hydrometry.The correlation found between insects growth and hydrometry is 0.05.A journalist concludes that a low correlation between insects growth and hydrometry shows that insects can reproduce easily in a dry climate.Do you agree with this interpretation?
(Multiple Choice)
4.9/5 (36)
A Science instructor assigns a group of students to investigate the relationship between their grade point average and their consistency in studying.The correlation between GPA and studying consistency is 0.857.Assume that the relation is linear.Describe the association.
(Multiple Choice)
4.8/5 (39)
Below are the Olympic gold medal performances in the men's high jump from 1960 to 1984. 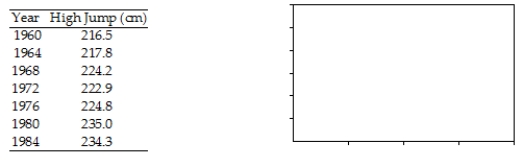
(Essay)
4.8/5 (41)
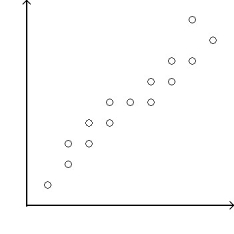
The owner of a small manufacturing plant employs nine people.As part of their personnel file,he asked each one to record the distance,in km,they travel one way from home to work and the time it takes in minutes. 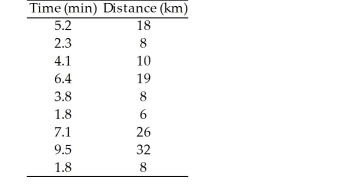
(Essay)
4.7/5 (40)
Determine whether the scatterplot shows little or no association, a negative association, a linear association, a moderately strong association, or a very strong association (multiple associations are possible).
-
(Multiple Choice)
4.8/5 (38)
Determine whether the scatterplot shows little or no association, a negative association, a linear association, a moderately strong association, or a very strong association (multiple associations are possible).
-
(Multiple Choice)
4.9/5 (45)
Filters
- Essay(0)
- Multiple Choice(0)
- Short Answer(0)
- True False(0)
- Matching(0)