Exam 6: Scatterplots, association, and Correlation
Exam 1: Data30 Questions
Exam 2: Displaying and Describing Categorical Data65 Questions
Exam 3: Displaying and Summarizing Quantitative Data93 Questions
Exam 4: Understanding and Comparing Distributions102 Questions
Exam 5: The Standard Deviation As a Ruler and the Normal Model131 Questions
Exam 6: Scatterplots, association, and Correlation74 Questions
Exam 7: Linear Regression57 Questions
Exam 8: Regression Wisdom32 Questions
Exam 9: Re-Expressing Data: Get It Straight51 Questions
Exam 10: Understanding Randomness26 Questions
Exam 11: Sample Surveys50 Questions
Exam 12: Experiments and Observational Surveys87 Questions
Exam 13: From Randomness to Probability64 Questions
Exam 14: Probability Rules90 Questions
Exam 15: Random Variables112 Questions
Exam 16: Probability Models114 Questions
Exam 17: Sampling Distribution Models45 Questions
Exam 18: Confidence Intervals for Proportions56 Questions
Exam 19: Testing Hypotheses About Proportions50 Questions
Exam 20: More About Tests69 Questions
Exam 21: Comparing Two Proportions52 Questions
Exam 22: Inferences About Means106 Questions
Exam 23: Comparing Means43 Questions
Exam 24: Paired Samples and Blocks33 Questions
Exam 25: Comparing Counts78 Questions
Exam 26: Inferences for Regression51 Questions
Exam 27: Analysis of Variance39 Questions
Exam 28: Multifactor Analysis of Variance22 Questions
Exam 29: Multiple Regression22 Questions
Exam 30: Multiple Regression Wisdom21 Questions
Exam 31: Rank-Based Nonparametric Tests29 Questions
Exam 32: The Bootstrap31 Questions
Select questions type
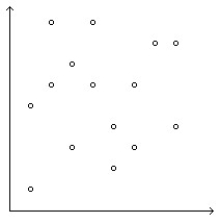
Several scatterplots are given with calculated correlations. Which is which?
-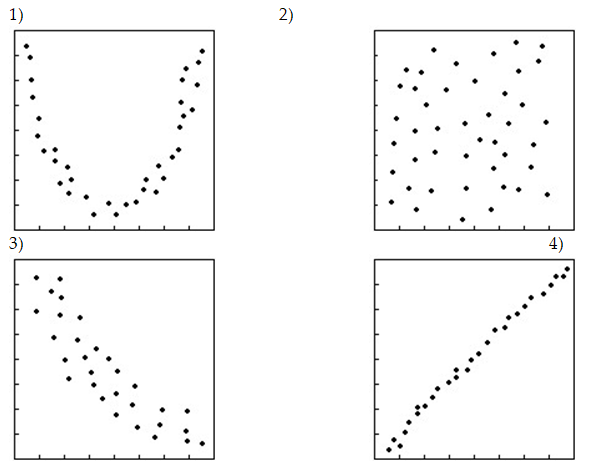 a)-0.798,b)0.009,c)0.084,d)0.948
(Multiple Choice)
4.8/5  (34)
(34)
Owners of a new appliances store tracked sales (in thousands)for the first 10 days,and displayed the data in a scatterplot.Make a histogram of the daily sales since the shop has been in business. 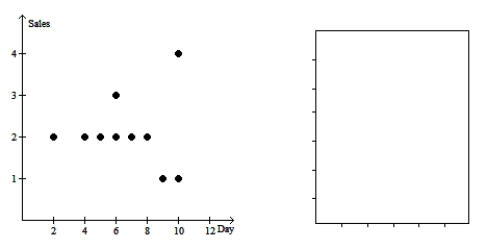
(Essay)
4.9/5 (42)
A science instructor assigns a group of students to investigate the relationship between the pH of the water of a river and its water's hardness (measured in grains).Some students wrote these conclusions: "there was a very strong correlation of 0.902 grains between pH of the water and water's hardness." Is the calculation of the correlation appropriate?
(Multiple Choice)
4.9/5 (40)
A scientist collects data to predict the wheat yield (in bushels per acre)based on rainfall (in millimetres).The results are recorded in the table below. 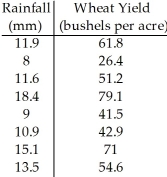
(Multiple Choice)
4.8/5 (43)
The following table gives the total sales (revenue)and profits for 8 retailers. 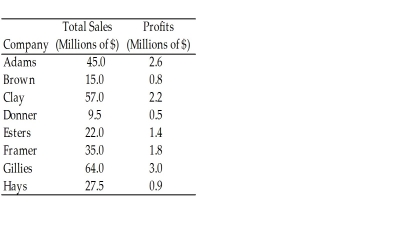
(Essay)
4.9/5 (34)
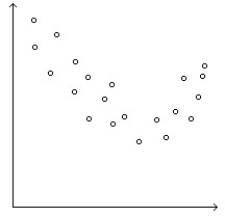
Determine whether the scatterplot shows little or no association, a negative association, a linear association, a moderately strong association, or a very strong association (multiple associations are possible).
-
(Multiple Choice)
4.8/5 (39)
Almost all of the acidity of soda pop comes from the phosphoric acid which is added to give them a sharper flavor.Is there a relation between the pH of the soda and the amount of phosphoric acid (in grams)? The pH and phosphoric acid content of 12 ounces of several brands of soda are shown on the following scatterplot.The correlation between pH and phosphoric acid is -0.956.Describe the association. 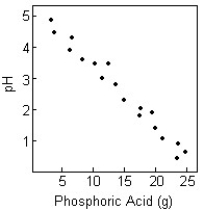
(Multiple Choice)
4.8/5 (35)
Oranges: circumference (centimetres),oranges: weight (grams)
(Multiple Choice)
4.8/5 (41)
Fast food is often considered unhealthy because much of it is high in both fat and calories.But are the two related? Here are the fat (in grams)and calories contents of several brands of burgers.If the fat was recorded in kilograms,how would this change the correlation? Suppose the relation is linear. 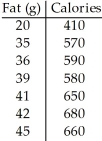
(Multiple Choice)
4.8/5 (38)
A science instructor assigns a group of students to investigate the relationship between the pH of the water of a river and its water's hardness (measured in grains).Some students wrote these conclusions: "there was a very strong correlation of 1.35 between pH of the water and water's hardness." Is the calculation of the correlation appropriate?
(Multiple Choice)
4.8/5 (27)
Owners of a small shop tracked the number of customers and the sales each hour for a 7 hour period.The results are recorded in the table below. 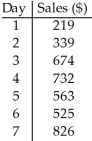
(Multiple Choice)
5.0/5 (27)
A group of persons filled in a questionnaire their age and the number of countries they had visited in their lifetime.The results are recorded in the table below. 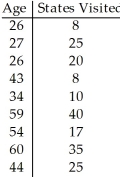
(Multiple Choice)
4.9/5 (42)
The table contains the daily study time for students from Statistics 101 and the grades on their quiz. 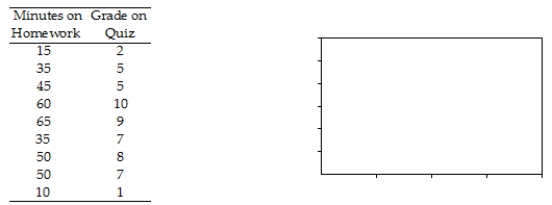
(Essay)
4.7/5 (30)
Several scatterplots are given with calculated correlations. Which is which?
-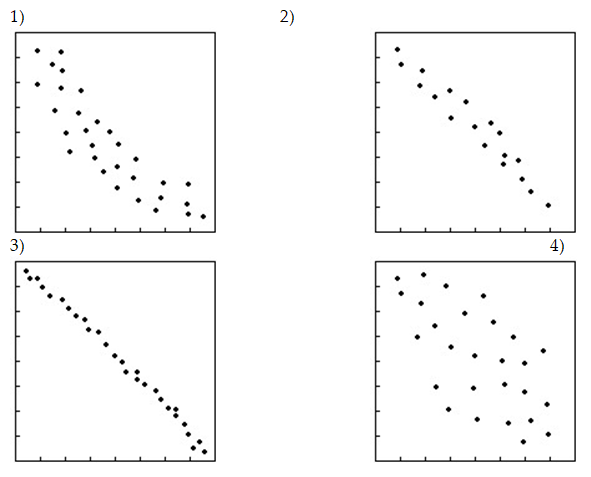 a)-0.847,b)-0.633,c)-0.433,d)-0.973
(Multiple Choice)
4.9/5 (45)
A survey was conducted in 26 counties to determine the percentage of teenagers who had used marijuana and other drugs.Data are displayed in the following scatterplot.Make a histogram of the other drugs. 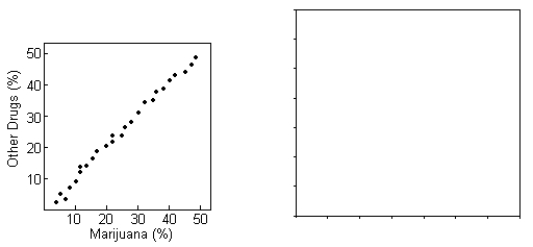
(Essay)
4.8/5 (38)
Determine whether the scatterplot shows little or no association, a negative association, a linear association, a moderately strong association, or a very strong association (multiple associations are possible).
-
(Multiple Choice)
4.8/5 (39)
Filters
- Essay(0)
- Multiple Choice(0)
- Short Answer(0)
- True False(0)
- Matching(0)