Exam 40: Population Ecology and the Distribution of Organisms
Exam 1: Introduction: Evolution and the Foundations of Biology36 Questions
Exam 2: The Chemical Context of Life135 Questions
Exam 3: Carbon and the Molecular Diversity of Life121 Questions
Exam 4: A Tour of the Cell72 Questions
Exam 5: Membrane Transport and Cell Signaling89 Questions
Exam 6: An Introduction to Metabolism74 Questions
Exam 7: Cellular Respiration and Fermentation90 Questions
Exam 8: Photosynthesis71 Questions
Exam 9: The Cell Cycle63 Questions
Exam 10: Meiosis and Sexual Life Cycles65 Questions
Exam 11: Mendel and the Gene Idea65 Questions
Exam 12: The Chromosomal Basis of Inheritance46 Questions
Exam 13: The Molecular Basis of Inheritance68 Questions
Exam 14: Gene Expression: From Gene to Protein83 Questions
Exam 15: Regulation of Gene Expression53 Questions
Exam 16: Development, Stem Cells, and Cancer34 Questions
Exam 17: Viruses35 Questions
Exam 18: Genomes and Their Evolution31 Questions
Exam 19: Descent With Modification54 Questions
Exam 20: Phylogeny53 Questions
Exam 21: The Evolution of Populations69 Questions
Exam 22: The Origin of Species60 Questions
Exam 23: Broad Patterns of Evolution38 Questions
Exam 24: Early Life and the Diversification of Prokaryotes89 Questions
Exam 25: The Origin and Diversification of Eukaryotes71 Questions
Exam 26: The Colonization of Land by Plants and Fungi153 Questions
Exam 27: The Rise of Animal Diversity107 Questions
Exam 28: Plant Structure and Growth50 Questions
Exam 29: Resource Acquisition, Nutrition, and Transport in Vascular Plants130 Questions
Exam 30: Reproduction and Domestication of Flowering Plants68 Questions
Exam 31: Plant Responses to Internal and External Signals71 Questions
Exam 32: Homeostasis and Endocrine Signaling122 Questions
Exam 33: Animal Nutrition61 Questions
Exam 34: Circulation and Gas Exchange77 Questions
Exam 35: The Immune System84 Questions
Exam 36: Reproduction and Development109 Questions
Exam 37: Neurons, Synapses, and Signaling68 Questions
Exam 38: Nervous and Sensory Systems89 Questions
Exam 39: Motor Mechanisms and Behavior74 Questions
Exam 40: Population Ecology and the Distribution of Organisms92 Questions
Exam 41: Species Interactions55 Questions
Exam 42: Ecosystems and Energy79 Questions
Exam 43: Global Ecology and Conservation Biology70 Questions
Select questions type
The eight climographs in Figure 40.1 show yearly temperature (line graph and left vertical axis) and precipitation (bar graph and right vertical axis) averages for each month for some locations on Earth. Choose the climograph that best answers the question.
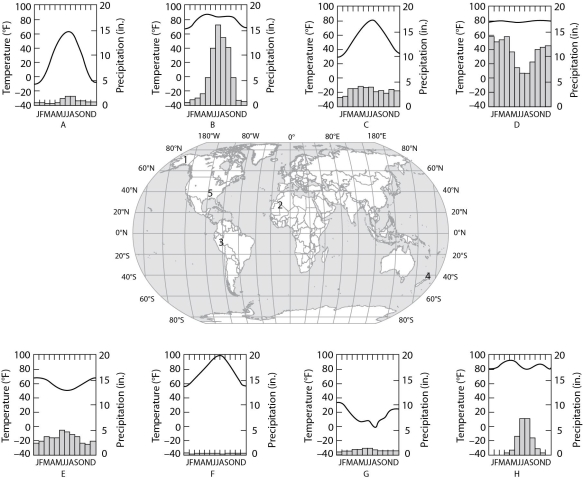 Figure 40.1
-Which climograph shows the climate for location 4?
Figure 40.1
-Which climograph shows the climate for location 4?
Free
(Multiple Choice)
4.7/5  (32)
(32)
Correct Answer: Verified
D
Palm trees and subtropical plants are commonplace in Land's End, England, whose latitude is the equivalent of Labrador in coastal Canada, where the local flora is subarctic. Which statement best explains why this apparent anomaly exists between North America and Europe?
Free
(Multiple Choice)
4.8/5 (33)
Correct Answer:Verified
B
Which variables define the ecological life history of a species?
Free
(Multiple Choice)
4.7/5 (36)
Correct Answer:Verified
A
Use the survivorship curves in Figure 40.3 to answer the following questions.
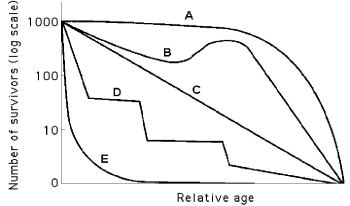 Figure 40.3
-Which statement best explains survivorship curve B?
Figure 40.3
-Which statement best explains survivorship curve B?
(Multiple Choice)
4.9/5 (45)
Which of the following are important biotic factors that can affect the structure and organization of biological communities?
(Multiple Choice)
4.9/5 (39)
Use the survivorship curves in Figure 40.3 to answer the following questions.
Figure 40.3
-Which curve best describes survivorship in elephants?
(Multiple Choice)
4.9/5 (34)
In which of the following terrestrial biome pairs are both dependent upon periodic burning?
(Multiple Choice)
4.8/5 (33)
Which of the following could be a density-independent factor limiting human population growth?
(Multiple Choice)
4.9/5 (35)
To construct a reproductive table for a sexual species, one needs to
(Multiple Choice)
4.7/5 (21)
In 2008, the population of New Zealand was approximately 4,275,000 people. If the birth rate was 14 births for every 1,000 people, approximately how many births occurred in New Zealand in 2008?
(Multiple Choice)
4.7/5 (32)
Which of the following levels of ecological organization is arranged in the correct sequence from most to least inclusive?
(Multiple Choice)
4.9/5 (26)
Figure 40.2 shows a generalized cross section of the marine environment with various zones labeled with letters. Choose the letter that best answers the question.
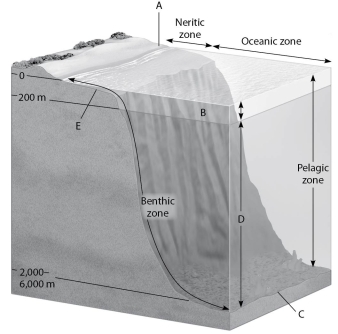 Figure 40.2
-Which zone produces the most global oxygen?
Figure 40.2
-Which zone produces the most global oxygen?
(Multiple Choice)
4.8/5 (31)
Figure 40.2 shows a generalized cross section of the marine environment with various zones labeled with letters. Choose the letter that best answers the question.
Figure 40.2
-Which zone has a condition of constant temperature?
(Multiple Choice)
4.9/5 (31)
Uniform spacing patterns in plants such as the creosote bush are most often associated with
(Multiple Choice)
4.8/5 (31)
In July 2008, the United States had a population of approximately 302,000,000 people. How many Americans were there in July 2009, if the estimated 2008 growth rate was 0.88%?
(Multiple Choice)
4.7/5 (31)
Filters
- Essay(0)
- Multiple Choice(0)
- Short Answer(0)
- True False(0)
- Matching(0)