Exam 40: Population Ecology and the Distribution of Organisms
Exam 1: Introduction: Evolution and the Foundations of Biology36 Questions
Exam 2: The Chemical Context of Life135 Questions
Exam 3: Carbon and the Molecular Diversity of Life121 Questions
Exam 4: A Tour of the Cell72 Questions
Exam 5: Membrane Transport and Cell Signaling89 Questions
Exam 6: An Introduction to Metabolism74 Questions
Exam 7: Cellular Respiration and Fermentation90 Questions
Exam 8: Photosynthesis71 Questions
Exam 9: The Cell Cycle63 Questions
Exam 10: Meiosis and Sexual Life Cycles65 Questions
Exam 11: Mendel and the Gene Idea65 Questions
Exam 12: The Chromosomal Basis of Inheritance46 Questions
Exam 13: The Molecular Basis of Inheritance68 Questions
Exam 14: Gene Expression: From Gene to Protein83 Questions
Exam 15: Regulation of Gene Expression53 Questions
Exam 16: Development, Stem Cells, and Cancer34 Questions
Exam 17: Viruses35 Questions
Exam 18: Genomes and Their Evolution31 Questions
Exam 19: Descent With Modification54 Questions
Exam 20: Phylogeny53 Questions
Exam 21: The Evolution of Populations69 Questions
Exam 22: The Origin of Species60 Questions
Exam 23: Broad Patterns of Evolution38 Questions
Exam 24: Early Life and the Diversification of Prokaryotes89 Questions
Exam 25: The Origin and Diversification of Eukaryotes71 Questions
Exam 26: The Colonization of Land by Plants and Fungi153 Questions
Exam 27: The Rise of Animal Diversity107 Questions
Exam 28: Plant Structure and Growth50 Questions
Exam 29: Resource Acquisition, Nutrition, and Transport in Vascular Plants130 Questions
Exam 30: Reproduction and Domestication of Flowering Plants68 Questions
Exam 31: Plant Responses to Internal and External Signals71 Questions
Exam 32: Homeostasis and Endocrine Signaling122 Questions
Exam 33: Animal Nutrition61 Questions
Exam 34: Circulation and Gas Exchange77 Questions
Exam 35: The Immune System84 Questions
Exam 36: Reproduction and Development109 Questions
Exam 37: Neurons, Synapses, and Signaling68 Questions
Exam 38: Nervous and Sensory Systems89 Questions
Exam 39: Motor Mechanisms and Behavior74 Questions
Exam 40: Population Ecology and the Distribution of Organisms92 Questions
Exam 41: Species Interactions55 Questions
Exam 42: Ecosystems and Energy79 Questions
Exam 43: Global Ecology and Conservation Biology70 Questions
Select questions type
A population is correctly defined as having which of the following characteristics? I. inhabiting the same general area
II) belonging to the same species
III) possessing a constant and uniform density and dispersion
(Multiple Choice)
4.8/5  (34)
(34)
Which pattern of reproduction is correctly paired with a species?
(Multiple Choice)
4.9/5 (34)
Which marine zone has the lowest rates of primary productivity (photosynthesis)?
(Multiple Choice)
4.9/5 (39)
The main reason polar regions are cooler than the equator is that
(Multiple Choice)
4.9/5 (33)
Why do some invertebrates, such as lobsters, show a "stair-step" survivorship curve?
(Multiple Choice)
4.8/5 (39)
Which of the following is most likely to contribute to density-dependent regulation of populations?
(Multiple Choice)
4.8/5 (39)
Use the survivorship curves in Figure 40.3 to answer the following questions.
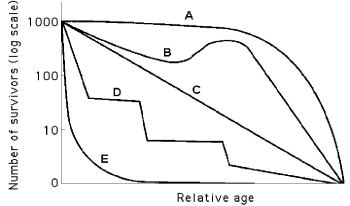 Figure 40.3
-Which curve best describes survivorship in marine molluscs?
Figure 40.3
-Which curve best describes survivorship in marine molluscs?
(Multiple Choice)
4.8/5 (29)
A certain species of pine tree survives only in scattered locations at elevations above 2,800 m in the western United States. To understand why this tree grows only in these specific places, an ecologist should
(Multiple Choice)
4.8/5 (29)
Which statement describes how climate might change if Earth was 75% land and 25% water?
(Multiple Choice)
4.9/5 (27)
The eight climographs in Figure 40.1 show yearly temperature (line graph and left vertical axis) and precipitation (bar graph and right vertical axis) averages for each month for some locations on Earth. Choose the climograph that best answers the question.
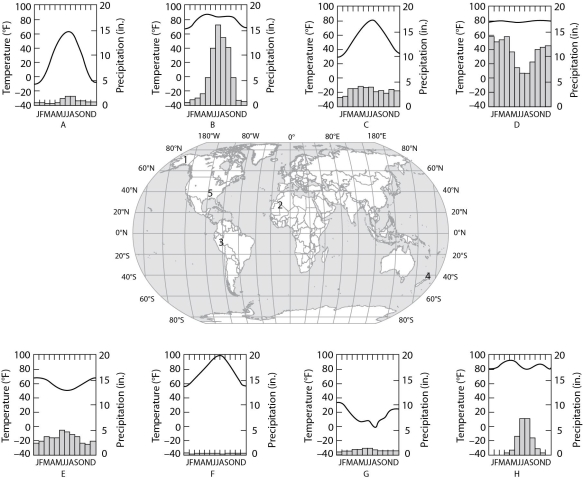 Figure 40.1
-Which climograph shows the climate for location 3?
Figure 40.1
-Which climograph shows the climate for location 3?
(Multiple Choice)
4.9/5 (34)
Which of the following graphs illustrates the growth curve of a small population of rodents that has grown to reach a static carrying capacity?
(Multiple Choice)
4.8/5 (32)
A population of ground squirrels has an annual per capita birth rate of 0.06 and an annual per capita death rate of 0.02. Calculate an estimate of the number of individuals added to (or lost from) a population of 1,000 individuals in one year.
(Multiple Choice)
4.9/5 (38)
Imagine that you are managing a large game ranch. You know from historical accounts that a species of deer used to live there, but they have been extirpated. You decide to reintroduce them. After doing some research to determine what might be an appropriately sized founding population, you do so. You then watch the population increase for several generations, and graph the number of individuals (vertical axis) against the number of generations (horizontal axis). The graph will likely appear as
(Multiple Choice)
4.9/5 (42)
The eight climographs in Figure 40.1 show yearly temperature (line graph and left vertical axis) and precipitation (bar graph and right vertical axis) averages for each month for some locations on Earth. Choose the climograph that best answers the question.
Figure 40.1
-Which of the following best substantiates why location 3 is an equatorial (tropical) climate?
(Multiple Choice)
4.9/5 (40)
If a meteor impact or volcanic eruption injected a lot of dust into the atmosphere and reduced the sunlight reaching Earth's surface by 70% for one year, which of the following marine communities most likely would be least affected?
(Multiple Choice)
4.9/5 (33)
Which of the following causes populations to shift most quickly from an exponential to a logistic population growth?
(Multiple Choice)
4.9/5 (31)
Why do populations grow more slowly as they approach their carrying capacity?
(Multiple Choice)
4.7/5 (29)
Filters
- Essay(0)
- Multiple Choice(0)
- Short Answer(0)
- True False(0)
- Matching(0)