Exam 2: Key Concept: the Derivative
Exam 1: A Library of Functions110 Questions
Exam 2: Key Concept: the Derivative92 Questions
Exam 3: Short-Cuts to Differentiation175 Questions
Exam 4: Using the Derivative108 Questions
Exam 5: Key Concept- the Definite Integral62 Questions
Exam 6: Constructing Antiderivatives90 Questions
Exam 7: Integration179 Questions
Exam 8: Using the Definite Integral104 Questions
Exam 9: Sequences and Series70 Questions
Exam 10: Approximating Functions Using Series71 Questions
Exam 11: Differential Equations135 Questions
Exam 12: Functions of Several Variables93 Questions
Exam 13: A Fundamental Tool- Vectors107 Questions
Exam 14: Differentiating Functions of Several Variables129 Questions
Exam 15: Optimization- Local and Global Extrema77 Questions
Exam 16: Integrating Functions of Several Variables76 Questions
Exam 17: Parameterization and Vector Fields86 Questions
Exam 18: Line Integrals78 Questions
Exam 19: Flux Integrals and Divergence52 Questions
Exam 20: The Curl and Stokes Theorem84 Questions
Exam 21: Parameters, Coordinates, Integrals23 Questions
Select questions type
Suppose a function is given by a table of values as follows:
x 1.1 1.3 1.5 1.7 1.9 2.1 f(x) 14 17 23 25 26 27 Give your best estimate of
.
(Short Answer)
4.8/5  (26)
(26)
Let .Use a graph to decide which one of the following statements is true.
(Multiple Choice)
4.8/5 (42)
Based on the graph of f(x)below:
a)List all values of x for which f is NOT differentiable.
b)List all values of x for which f is NOT continuous.
c)List all values of x for which f '(x)= 0. 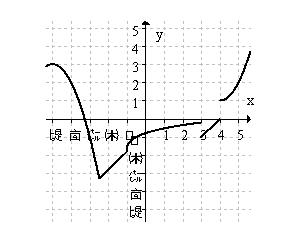
(Essay)
4.8/5 (34)
A golf ball thrown directly upwards from the surface of the moon with an initial velocity of 17.00 meters per second and will attain a height of
meters in t seconds.Find a formula for the velocity of the golf ball at time t.
(Multiple Choice)
4.8/5 (32)
For
, estimate f '(3)to 3 decimal places by finding the average slope over intervals containing the value x = 3.
(Short Answer)
4.8/5 (34)
A typhoon is a tropical cyclone, like a hurricane, that forms in the northwestern Pacific Ocean.The wind speed of a typhoon is given by a function W = w(r)where W is measured in meters/sec., and r is measured in kilometers from the center of the typhoon.What does the statement that w'(15)> 0 tell you about the typhoon?
(Multiple Choice)
4.7/5 (48)
A runner competed in a half marathon in Anaheim, a distance of 13.1 miles.She ran the first 7 miles at a steady pace in 48 minutes, the second 3 miles at a steady pace in 28 minutes and the last 3.1 miles at a steady pace in 18 minutes.
a)Sketch a well-labeled graph of her distance completed with respect to time.
b)Sketch a well-labeled graph of her velocity with respect to time.
(Essay)
4.9/5 (27)
A golf ball thrown directly upwards from the surface of the moon with an initial velocity of 14.00 meters per second and will attain a height of
meters in t seconds.What is the acceleration of the golf ball at time t?
(Multiple Choice)
4.8/5 (31)
The graph below represents the rate of change of a function f with respect to x; i.e., it is a graph of f '.You are told that f (0)= 0.What can you say about
at the point x = 1.3? Mark all that apply. 
(Multiple Choice)
4.9/5 (40)
On the axes below, sketch a smooth, continuous curve , and which clearly satisfies the following conditions:
• Concave up to the left of P
• Concave down to the right of P
• Increasing for x > 0
• Decreasing for x < 0
• Does not pass through the origin. 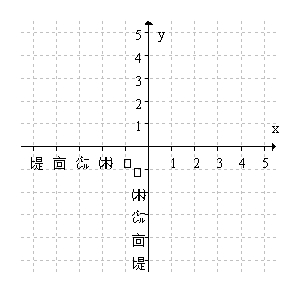
(Essay)
4.8/5 (39)
Assume that f is a differentiable function defined on all of the real line.Is it possible that f > 0 everywhere, f ' > 0 everywhere, and f ' < 0 everywhere?
(True/False)
4.8/5 (33)
A company graphs C'(t), the derivative of the number of pints of ice cream sold over the past ten years.At approximately what year was C ''(t)greatest? 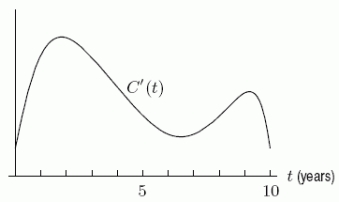
(Short Answer)
4.8/5 (39)
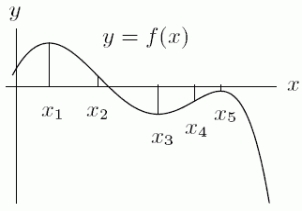
The graph of
is given in the following figure.What happens to
at the point
? 

(Multiple Choice)
4.8/5 (40)
The graph below shows the velocity of a bug traveling along a straight line on the classroom floor. 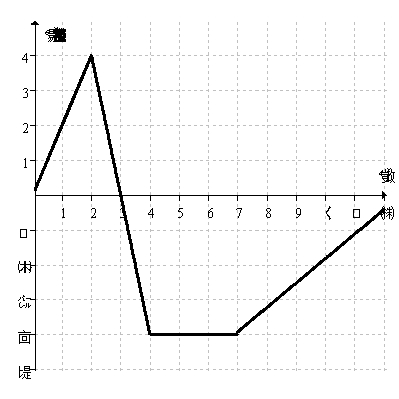 At what time(s)does the bug turn around?
(Multiple Choice)
4.8/5 (43)
Esther is a swimmer who prides herself in having a smooth backstroke.Let s(t)be her position in an Olympic size (50-meter)pool, as a function of time (s(t)is measured in meters, t is seconds).Below we list some values of s(t), for a recent swim.Based on the data, was Esther's instantaneous speed ever greater than 3 meters/second?
t 0 3.0 8.6 14.6 20.8 27.6 31.9 38.1 45.8 53.9 60 s(t) 0 10 20 30 40 50 40 30 20 10 0
(Short Answer)
4.8/5 (37)
To find the derivative of
at x = 8 algebraically, you evaluate the following expression.
(Multiple Choice)
4.8/5 (34)
The graph below represents the rate of change of a function f with respect to x; i.e., it is a graph of f'.You are told that f(0)= -2.For approximately what value of x other than x = 0 in the interval 0 x 2 does
= -2? 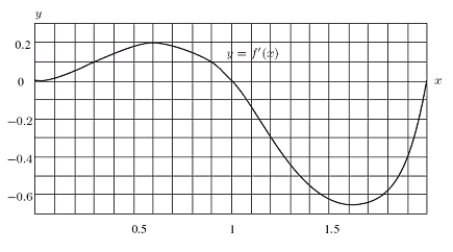
(Multiple Choice)
4.8/5 (43)
To study traffic flow along a major road, the city installs a device at the edge of the road at 3:00a.m.The device counts the cars driving past, and records the total periodically.The resulting data is plotted on a graph, with time (in hours since installation)on the horizontal axis and the number of cars on the vertical axis.The graph is shown below; it is the graph of the function C(t)= Total number of cars that have passed by after t hours.From the graph, estimate C'(6). 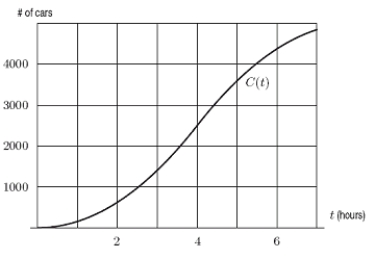
(Multiple Choice)
4.8/5 (40)
Filters
- Essay(0)
- Multiple Choice(0)
- Short Answer(0)
- True False(0)
- Matching(0)