Exam 53: Population Ecology
Exam 1: Evolution, the Themes of Biology, and Scientific Inquiry51 Questions
Exam 2: The Chemical Context of Life61 Questions
Exam 3: Water and Life55 Questions
Exam 4: Carbon and the Molecular Diversity of Life58 Questions
Exam 5: The Structure and Function of Large Biological Molecules70 Questions
Exam 6: A Tour of the Cell66 Questions
Exam 7: Membrane Structure and Function68 Questions
Exam 8: An Introduction to Metabolism67 Questions
Exam 9: Cellular Respiration and Fermentation68 Questions
Exam 10: Photosynthesis65 Questions
Exam 11: Cell Communication65 Questions
Exam 12: The Cell Cycle66 Questions
Exam 13: Meiosis and Sexual Life Cycles64 Questions
Exam 14: Mendel and the Gene Idea62 Questions
Exam 15: The Chromosomal Basis of Inheritance58 Questions
Exam 16: The Molecular Basis of Inheritance65 Questions
Exam 17: Gene Expression: From Gene to Protein67 Questions
Exam 18: Regulation of Gene Expression66 Questions
Exam 19: Viruses54 Questions
Exam 20: DNA Tools and Biotechnology57 Questions
Exam 21: Genomes and Their Evolution44 Questions
Exam 22: Descent with Modification: A Darwinian View of Life60 Questions
Exam 23: The Evolution of Populations64 Questions
Exam 24: The Origin of Species67 Questions
Exam 25: The History of Life on Earth59 Questions
Exam 26: Phylogeny and the Tree of Life75 Questions
Exam 27: Bacteria and Archaea75 Questions
Exam 28: Protists79 Questions
Exam 29: Plant Diversity I: How Plants Colonized Land82 Questions
Exam 30: Plant Diversity II: The Evolution of Seed Plants80 Questions
Exam 31: Fungi75 Questions
Exam 32: An Overview of Animal Diversity67 Questions
Exam 33: An Introduction to Invertebrates83 Questions
Exam 34: The Origin and Evolution of Vertebrates82 Questions
Exam 35: Vascular Plant Structure, Growth, and Development65 Questions
Exam 36: Resource Acquisition and Transport in Vascular Plants74 Questions
Exam 37: Soil and Plant Nutrition52 Questions
Exam 38: Angiosperm Reproduction and Biotechnology60 Questions
Exam 39: Plant Responses to Internal and External Signals61 Questions
Exam 40: Basic Principles of Animal Form and Function68 Questions
Exam 41: Animal Nutrition64 Questions
Exam 42: Circulation and Gas Exchange67 Questions
Exam 43: The Immune System69 Questions
Exam 44: Osmoregulation and Excretion64 Questions
Exam 45: Hormones and the Endocrine System66 Questions
Exam 46: Animal Reproduction68 Questions
Exam 47: Animal Development70 Questions
Exam 48: Neurons, Synapses, and Signaling68 Questions
Exam 49: Nervous Systems65 Questions
Exam 50: Sensory and Motor Mechanisms67 Questions
Exam 51: Animal Behavior69 Questions
Exam 52: An Introduction to Ecology and the Biosphere68 Questions
Exam 53: Population Ecology69 Questions
Exam 54: Community Ecology71 Questions
Exam 55: Ecosystems and Restoration Ecology68 Questions
Exam 56: Conservation Biology and Global Change69 Questions
Select questions type
Use the survivorship curves in the figure to answer the following question.
 Which curve best describes survivorship in elephants?
Free
(Multiple Choice)
4.9/5  (28)
(28)
Correct Answer: Verified
A
Use the figure to answer the following question.
Life Table for Zootoca vivipara in the Netherlands
Year 0 1 2 3 4 5 6 7 Number alive 1000 763 308 158 75 10 7 2 Survivorship 1.000 0.763 0.308 0.158 0.057 0.010 0.007 0.002 Fecundity 0.00 1.70 2.94 4.13 4.88 6.50 6.40 6.30 Survivorship × Fecundity = Average Number of Offspring Produced per Female of Age x 0.00 1.30 0.91 0.65 0.28 0.07 0.04 0.01
Data are from Strijbosch and Creemers, 1988.
Using the table, how would you describe the population dynamics of the Eurasian lizard, Z. vivipara?
Free
(Multiple Choice)
4.9/5 (45)
Correct Answer:Verified
A
Use the figure to answer the following question.
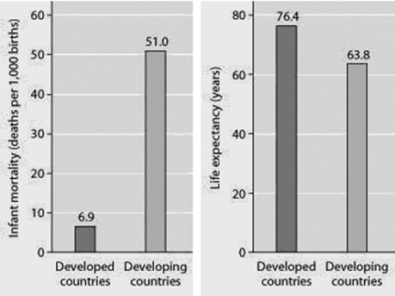 Infant mortality and life expectancy at birth in developed and developing countries (data as of 2005).
What is a logical conclusion that can be drawn from the graphs? Developed countries have ________.
Infant mortality and life expectancy at birth in developed and developing countries (data as of 2005).
What is a logical conclusion that can be drawn from the graphs? Developed countries have ________.
Free
(Multiple Choice)
4.8/5 (27)
Correct Answer:Verified
C
Based on current growth rates, Earth's human population in 2019 will be closest to
(Multiple Choice)
4.9/5 (31)
An ecologist recorded 12 white-tailed deer, Odocoileus virginianus, per square kilometer (km²)in one woodlot and 20 km² in another woodlot. What was the ecologist comparing?
(Multiple Choice)
4.7/5 (43)
Starting from a single individual, what is the size of a population of bacteria at the end of a 2-hour time period if they reproduce by binary fission every 20 minutes? (Assume unlimited resources and no mortality.)
(Multiple Choice)
4.7/5 (31)
The observation that members of a population are uniformly distributed suggests that
(Multiple Choice)
4.8/5 (27)
Which of the following graphs illustrates the population growth curve starting with a single bacterium growing in a flask of ideal medium at optimum temperature over a two-hour period? Assume resources do not become limiting over this time frame.
(Multiple Choice)
4.7/5 (33)
Natural selection involves energetic trade-offs between ________.
(Multiple Choice)
4.9/5 (37)
Use the graph to answer the following question.
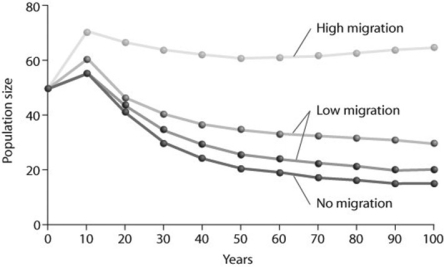 Looking at the figure, what factor is contributing significantly to stabilizing the population size over time?
I.no migration
II.low migration
III.high migration
Looking at the figure, what factor is contributing significantly to stabilizing the population size over time?
I.no migration
II.low migration
III.high migration
(Multiple Choice)
4.9/5 (34)
Use the graphs to answer the following question.
(a)
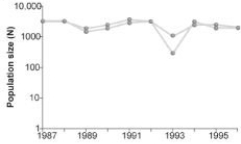 (b)
(b)
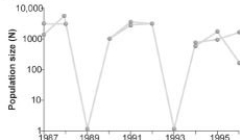 Graph (b)in the figure shows the normal fluctuations of a population of grouse, a ground-nesting bird. Assuming graph (a)in the figure is the result of some experimental treatment in the grouse population, what can be concluded?
(Multiple Choice)
4.7/5 (32)
Which of the following groups would be most likely to exhibit uniform dispersion?
(Multiple Choice)
4.7/5 (31)
Which of the following causes populations to shift most quickly from an exponential to a logistic population growth?
(Multiple Choice)
4.8/5 (31)
A population of white-footed mice becomes severely overpopulated in a habitat that has been disturbed by human activity. Sometimes intrinsic factors cause the population to increase in mortality and cause lower reproduction rates to occur in reaction to the stress of overpopulation. Which of the following is an example of intrinsic population control?
(Multiple Choice)
4.8/5 (38)
Scientific study of the population cycles of the snowshoe hare and its predator, the lynx, has revealed that
(Multiple Choice)
4.9/5 (35)
Use the survivorship curves in the figure to answer the following question.
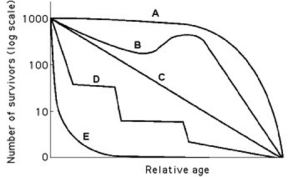 Which curve best describes survivorship in marine mollusks?
(Multiple Choice)
4.8/5 (42)
Which of the following statements regarding the future of populations in developing, less industrialized countries are correct?
I.The reproductive rates are predicted to remain below replacement level.
II.Survivorship will increase.
III.Overall population size will increase dramatically.
IV.The fertility rate is predicted to remain high, especially in some regions.
(Multiple Choice)
4.7/5 (41)
Use the graph to answer the following question.
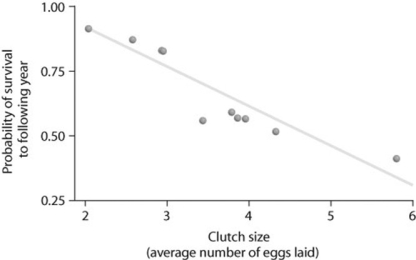 Looking at the data in the figure, what can be said about survival and clutch size?
(Multiple Choice)
4.8/5 (40)
Use the figure to answer the following question.
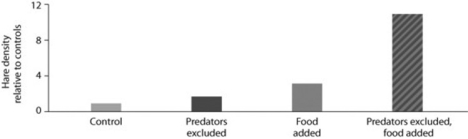 Looking at the data in the figure from the hare/lynx experiment, what conclusion(s)can you draw?
I.Food is a factor in controlling hare population size.
II.Excluding lynx is a factor in controlling hare population size.
III.The effect of excluding predators and adding food in the same experiment is greater than the sum of excluding lynx alone plus adding food alone.
Looking at the data in the figure from the hare/lynx experiment, what conclusion(s)can you draw?
I.Food is a factor in controlling hare population size.
II.Excluding lynx is a factor in controlling hare population size.
III.The effect of excluding predators and adding food in the same experiment is greater than the sum of excluding lynx alone plus adding food alone.
(Multiple Choice)
4.8/5 (30)
Filters
- Essay(0)
- Multiple Choice(0)
- Short Answer(0)
- True False(0)
- Matching(0)