Exam 19: Statistical Process Control
Exam 1: Operations and Productivity129 Questions
Exam 2: Operations Strategy in a Global Environment120 Questions
Exam 3: Project Management124 Questions
Exam 4: Forecasting141 Questions
Exam 5: Design of Goods and Services121 Questions
Exam 6: Managing Quality125 Questions
Exam 7: Process Strategy113 Questions
Exam 8: Location Strategies121 Questions
Exam 9: Layout Strategies146 Questions
Exam 10: Human Resources,job Design,and Work Measurement159 Questions
Exam 11: Supply Chain Management145 Questions
Exam 12: Inventory Management165 Questions
Exam 13: Aggregate Planning and Sop116 Questions
Exam 14: Material Requirements Planning Mrpand ERP113 Questions
Exam 15: Short-Term Scheduling116 Questions
Exam 16: Lean Operations116 Questions
Exam 17: Maintenance and Reliability114 Questions
Exam 18: Sustainability in the Supply Chain84 Questions
Exam 19: Statistical Process Control144 Questions
Exam 20: Capacity and Constraint Management101 Questions
Exam 21: Supply Chain Management Analytics67 Questions
Exam 22: Decision-Making Tools100 Questions
Exam 23: Linear Programming98 Questions
Exam 24: Transportation Models89 Questions
Exam 25: Waiting-Line Models119 Questions
Exam 26: Learning Curves110 Questions
Exam 27: Simulation75 Questions
Select questions type
Red Top Cab Company receives multiple complaints per day about driver behavior.Over 9 days the owner recorded the number of calls to be 3,0,8,9,6,7,4,9,and 8.What is the upper control limit for the 3-sigma c-chart?
(Multiple Choice)
4.7/5  (38)
(38)
A city police chief decides to do an annual review of the police department by checking the number of monthly complaints.If the total number of complaints in each of the 12 months were 15,18,13,12,16,20,5,10,9,11,8,and 3 and the police chief wants a 90% confidence level,are the complaints in control?
(Essay)
4.9/5 (37)
The probability of rejecting a good lot is known as consumer's risk.
(True/False)
4.7/5 (40)
An operator trainee is attempting to monitor a filling process that has an overall average of 705 cc.The average range is 17 cc.If you use a sample size of 6,what are the upper and lower control limits for the x-bar chart and R-chart?
(Essay)
4.9/5 (43)
Ten samples of size four were taken from a process,and their weights measured.The sample averages and sample ranges are in the following table.Construct and plot an x-bar and R-chart using these data.Is the process in control?
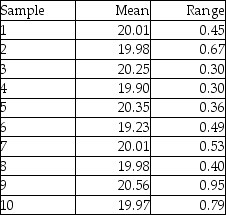
(Essay)
4.9/5 (39)
McDaniel Shipyards wants to develop a control chart to assess the quality of its steel plate.They take ten sheets of 1" steel plate and compute the number of cosmetic flaws on each roll.Each sheet is 20' by 100'.Based on the following data,develop limits for the 3-sigma control chart,plot the control chart,and determine whether the process is in control.
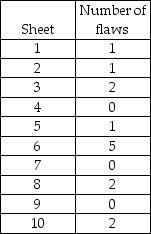
(Essay)
4.8/5 (33)
The width of a bronze bar is intended to be one-eighth of an inch (0.125 inches).Inspection samples contain five bars each.The average range of these samples is 0.01 inches.What are the upper and lower control limits for the x-bar and R-chart for this process,using 3-sigma limits?
(Essay)
4.9/5 (36)
Control charts for variables are based on data that come from:
(Multiple Choice)
4.8/5 (37)
A retail store manager is trying to improve and control the rate at which cashiers sign customers up
for store credit cards.Suppose the manager takes 10 samples,each with 100 observations.The p-bar
value is found to be .05,and the manager does not want a lower limit below .0064.What z-value would this imply,and how confident can she be that the true lower limit is greater than or equal to .0064?
(Essay)
4.9/5 (29)
A department chair wants to monitor the percentage of failing students in classes in her department.Each class had an enrollment of 50 students last spring.The number of failing students in the 10 classes offered that term were 1,4,2,0,0,0,0,0,0,and 3,respectively.Compute the control limits for a p-chart at the 95% confidence level.Is the process in control?
(Essay)
4.8/5 (24)
The ________ is a quality control chart that indicates when changes occur in the central tendency of a production process.
(Essay)
4.9/5 (41)
________ is a method of measuring samples of lots or batches of product against predetermined standards.
(Essay)
4.8/5 (31)
The specifications for a manifold gasket that installs between two engine parts calls for a thickness of 2.500 mm ± .020 mm.The standard deviation of the process is estimated to be 0.004 mm.The process is currently operating at a mean thickness of 2.50 mm.(a)What are the upper and lower specification limits for this product? (b)What is the Cp for this process? (c)The purchaser of these parts requires a capability index of 1.50.Is this process capable? Is this process good enough for the supplier? (d)If the process mean were to drift from its setting of 2.500 mm to a new mean of 2.497,would the process still be good enough for the supplier's needs?
(Essay)
5.0/5 (44)
At your first job out of college you have been assigned to the production of bottled 20 oz.soda.
The process has upper and lower spec limits of 20.5 and 19.5 oz,respectively,with a mean of 19.8 oz
and standard deviation of .1 oz.Your manager has requested the process produce no more than 3.4
defects per 1 million bottles produced.Calculate Cpk and then determine if the process is capable according to the manager's standard.
(Essay)
4.8/5 (41)
Filters
- Essay(0)
- Multiple Choice(0)
- Short Answer(0)
- True False(0)
- Matching(0)