Exam 19: Statistical Process Control
Exam 1: Operations and Productivity129 Questions
Exam 2: Operations Strategy in a Global Environment120 Questions
Exam 3: Project Management124 Questions
Exam 4: Forecasting141 Questions
Exam 5: Design of Goods and Services121 Questions
Exam 6: Managing Quality125 Questions
Exam 7: Process Strategy113 Questions
Exam 8: Location Strategies121 Questions
Exam 9: Layout Strategies146 Questions
Exam 10: Human Resources,job Design,and Work Measurement159 Questions
Exam 11: Supply Chain Management145 Questions
Exam 12: Inventory Management165 Questions
Exam 13: Aggregate Planning and Sop116 Questions
Exam 14: Material Requirements Planning Mrpand ERP113 Questions
Exam 15: Short-Term Scheduling116 Questions
Exam 16: Lean Operations116 Questions
Exam 17: Maintenance and Reliability114 Questions
Exam 18: Sustainability in the Supply Chain84 Questions
Exam 19: Statistical Process Control144 Questions
Exam 20: Capacity and Constraint Management101 Questions
Exam 21: Supply Chain Management Analytics67 Questions
Exam 22: Decision-Making Tools100 Questions
Exam 23: Linear Programming98 Questions
Exam 24: Transportation Models89 Questions
Exam 25: Waiting-Line Models119 Questions
Exam 26: Learning Curves110 Questions
Exam 27: Simulation75 Questions
Select questions type
If the process average is in control,then the process range must also be in control.
(True/False)
5.0/5  (40)
(40)
The x-bar chart indicates that a gain or loss of uniformity has occurred in dispersion of a production process.
(True/False)
4.9/5 (39)
Which of the following statements about acceptance sampling is true?
(Multiple Choice)
4.8/5 (41)
If  = 23 ounces,σ = 0.4 ounces,and n = 16,what will be the ±3σ control limits for the x-bar chart?
(Multiple Choice)
4.9/5 (27)
Examine the Statistical Process Control outputs below.Answer the following questions.
a.What is the sample size?
b.What is the number of samples?
c.What is the mean of sample 8;what is the range of sample 10?
d..Is this process in control? Explain--a simple Yes or No is insufficient.
e.What additional steps should the quality assurance team take? 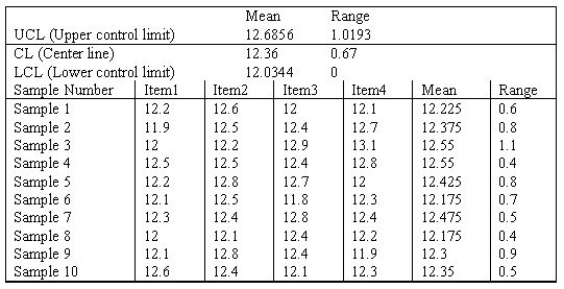
(Essay)
4.9/5 (34)
In statistical process control,the range is often used as a substitute for the standard deviation.
(True/False)
4.8/5 (37)
A small,independent amusement park collects data on the number of cars with out-of-state license plates.The sample size is fixed at n=25 each day.Data from the previous 10 days indicate the following number of out-of-state license plates:
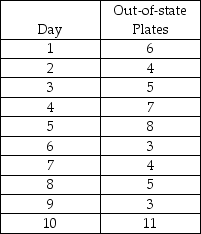 (a)Calculate the overall proportion of "tourists" (cars with out-of-state plates)and the standard deviation of proportions.
(b)Using ±3σ limits,calculate the LCL and UCL for these data.
(c)Is the process under control? Explain.
(a)Calculate the overall proportion of "tourists" (cars with out-of-state plates)and the standard deviation of proportions.
(b)Using ±3σ limits,calculate the LCL and UCL for these data.
(c)Is the process under control? Explain.
(Essay)
5.0/5 (47)
The term ________ is used to describe how well a process makes units within design specifications (or tolerances).
(Essay)
4.9/5 (38)
A part that connects two levels should have a distance between the two holes of 4".It has been determined that x-bar and R-charts should be set up to determine if the process is in statistical control.The following ten samples of size four were collected.Calculate the control limits,plot the control charts,and determine if the process is in control.
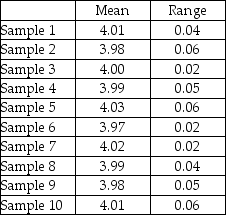
(Essay)
5.0/5 (37)
Pierre's Motorized Pirogues and Mudboats is setting up an acceptance sampling plan for the special air cleaners he manufactures for his boats.His specifications,and the resulting plan,are shown on the POM for Windows output below.Pierre wants acceptance sampling to remove ALL defects from his production of air cleaners.Explain carefully why this won't happen. 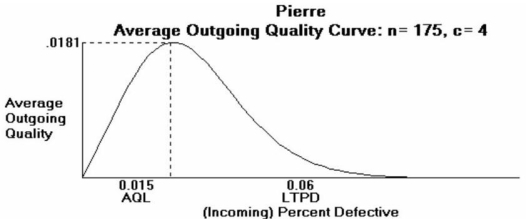
(Essay)
5.0/5 (43)
Briefly explain what the Central Limit Theorem has to do with control charts.
(Essay)
4.9/5 (32)
A process is operating in such a manner that the mean of the process is exactly on the lower specification limit.What must be true about the two measures of capability for this process?
(Essay)
4.8/5 (25)
To set x-bar chart upper and lower control limits,one must know the process central line,which is the:
(Multiple Choice)
4.9/5 (41)
A consultant has been brought in to a manufacturing plant to help apply Six Sigma principles.Her first task is to work on the production of rubber balls.The upper and lower spec limits are 21 and 19 cm,respectively.The consultant takes ten samples of size five and computes the sample standard deviation to be .7 cm and the sample mean to be 19.89 cm.Compute Cp and Cpk for the process.Give the consultant advice on what to do with the process based on your findings.
(Essay)
4.8/5 (32)
Repeated sampling of a certain process shows the average of all sample ranges to be 1.0 cm.The sample size has been constant at n = 5.What are the 3-sigma control limits for this R-chart?
(Essay)
4.8/5 (39)
When a lot has been accepted by acceptance sampling,we know that:
(Multiple Choice)
4.9/5 (33)
A manager wishes to build a 3-sigma range chart for a process.The sample size is five,the mean of sample means is 16.01,and the average range is 5.3.From Table S6.1,the appropriate value of D3 is 0,and D4 is 2.115.What are the UCL and LCL,respectively,for this range chart?
(Multiple Choice)
4.8/5 (34)
Filters
- Essay(0)
- Multiple Choice(0)
- Short Answer(0)
- True False(0)
- Matching(0)