Exam 19: Statistical Process Control
Exam 1: Operations and Productivity129 Questions
Exam 2: Operations Strategy in a Global Environment120 Questions
Exam 3: Project Management124 Questions
Exam 4: Forecasting141 Questions
Exam 5: Design of Goods and Services121 Questions
Exam 6: Managing Quality125 Questions
Exam 7: Process Strategy113 Questions
Exam 8: Location Strategies121 Questions
Exam 9: Layout Strategies146 Questions
Exam 10: Human Resources,job Design,and Work Measurement159 Questions
Exam 11: Supply Chain Management145 Questions
Exam 12: Inventory Management165 Questions
Exam 13: Aggregate Planning and Sop116 Questions
Exam 14: Material Requirements Planning Mrpand ERP113 Questions
Exam 15: Short-Term Scheduling116 Questions
Exam 16: Lean Operations116 Questions
Exam 17: Maintenance and Reliability114 Questions
Exam 18: Sustainability in the Supply Chain84 Questions
Exam 19: Statistical Process Control144 Questions
Exam 20: Capacity and Constraint Management101 Questions
Exam 21: Supply Chain Management Analytics67 Questions
Exam 22: Decision-Making Tools100 Questions
Exam 23: Linear Programming98 Questions
Exam 24: Transportation Models89 Questions
Exam 25: Waiting-Line Models119 Questions
Exam 26: Learning Curves110 Questions
Exam 27: Simulation75 Questions
Select questions type
Plots of sample ranges indicate that the most recent value is below the lower control limit.What course of action would you recommend?
(Multiple Choice)
4.9/5  (36)
(36)
A process range chart illustrates the amount of dispersion within the samples.
(True/False)
4.8/5 (37)
A quality analyst wants to construct a sample mean chart for controlling a packaging process.He knows from past experience that the process standard deviation is two ounces.Each day last week,he randomly selected four packages and weighed each.The data from that activity appear below.
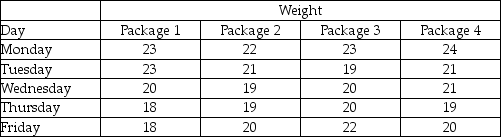 (a)Calculate all sample means and the mean of all sample means.
(b)Calculate upper and lower 2-sigma x-bar chart control limits that allow for natural variations.
(c)Based on the x-bar chart,is this process in control?
(a)Calculate all sample means and the mean of all sample means.
(b)Calculate upper and lower 2-sigma x-bar chart control limits that allow for natural variations.
(c)Based on the x-bar chart,is this process in control?
(Essay)
4.9/5 (30)
What is the difference between natural and assignable causes of variation?
(Essay)
5.0/5 (30)
Filters
- Essay(0)
- Multiple Choice(0)
- Short Answer(0)
- True False(0)
- Matching(0)