Exam 18: Statistical Process Control
Exam 1: Operations and Productivity126 Questions
Exam 2: Operations Strategy in a Global Environment135 Questions
Exam 3: Project Management121 Questions
Exam 4: Forecasting144 Questions
Exam 5: Sustainability in the Supply Chain and Design of Goods and Services137 Questions
Exam 6: Managing Quality129 Questions
Exam 7: Process Strategy and Sustainability131 Questions
Exam 8: Location Strategies139 Questions
Exam 9: Layout Strategies161 Questions
Exam 10: Human Resources,job Design,and Work Measurement192 Questions
Exam 11: Supply-Chain Management145 Questions
Exam 12: Inventory Management168 Questions
Exam 13: Aggregate Planning134 Questions
Exam 14: Material Requirements Planning Mrpand ERP169 Questions
Exam 15: Short-Term Scheduling139 Questions
Exam 16: Jit and Lean Operations137 Questions
Exam 17: Maintenance and Reliability130 Questions
Exam 18: Statistical Process Control156 Questions
Exam 19: Capacity and Constraint Management107 Questions
Exam 20: Supply Chain Management Analytics55 Questions
Exam 21: Decision-Making Tools97 Questions
Exam 22: Linear Programming100 Questions
Exam 23: Transportation Models94 Questions
Exam 24: Waiting-Line Models135 Questions
Exam 25: Learning Curves111 Questions
Exam 26: Simulation92 Questions
Select questions type
The width of a bronze bar is intended to be one-eighth of an inch (0.125 inches).Inspection samples contain five bars each.The average range of these samples is 0.01 inches.What are the upper and lower control limits for the x-bar and R-chart for this process,using 3-sigma limits?
Free
(Essay)
4.8/5  (37)
(37)
Correct Answer: Verified
X-bar: LCL = .119;UCL = .131.R: LCL = 0.0;UCL = .021
The higher the process capability ratio,the greater the likelihood that process will be within design specifications.
Free
(True/False)
4.7/5 (33)
Correct Answer:Verified
True
A hospital-billing auditor has been inspecting patient bills.While almost all bills contain some errors,the auditor is looking now for large errors (errors in excess of $250).Among the last 100 bills inspected,the defect rate has been 16%.Calculate the upper and lower limits for the billing process for 99.7% confidence.
Free
(Essay)
4.8/5 (34)
Correct Answer:Verified
0.16 plus or minus 3 × 0.03667,or .050 to 0.270
________ is a method of measuring samples of lots or batches of product against predetermined standards.
(Essay)
4.9/5 (36)
The ________ is a quality control chart that indicates when changes occur in the central tendency of a production process.
(Essay)
4.8/5 (36)
The ________ is the lowest level of quality that we are willing to accept.
(Essay)
4.9/5 (31)
________ is variation in a production process that can be traced to specific causes.
(Essay)
4.8/5 (37)
Which of the following is true about cutting costs at Canada Bankers Life Assurance Company?
(Multiple Choice)
4.8/5 (31)
The  index measures the difference between desired and actual dimensions of goods or services produced.
(True/False)
5.0/5 (27)
The x-bar chart,like the c-chart,is based on the exponential distribution.
(True/False)
4.9/5 (37)
A nationwide parcel delivery service keeps track of the number of late deliveries (more than 30 minutes past the time promised to clients)per day.They plan on using a control chart to plot their results.Which type of control chart(s)would you recommend?
(Multiple Choice)
5.0/5 (34)
Plots of sample ranges indicate that the most recent value is below the lower control limit.What course of action would you recommend?
(Multiple Choice)
4.8/5 (29)
A retail store manager is trying to improve and control the rate at which cashiers sign customers up for store credit cards.Suppose that the manager wants the maximum standard deviation of the sampling distribution to be 5% and he cannot estimate p-bar.How many observations per sample would this require?
(Essay)
4.9/5 (47)
Pierre's Motorized Pirogues and Mudboats is setting up an acceptance sampling plan for the special air cleaners he manufactures for his boats.His specifications,and the resulting plan,are shown on the POM for Windows output below.Pierre wants acceptance sampling to remove ALL defects from his production of air cleaners.Explain carefully why this won't happen. 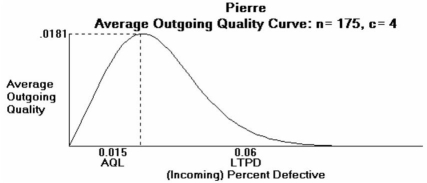
(Essay)
4.9/5 (38)
The x-bar chart indicates that a gain or loss of uniformity has occurred in dispersion of a production process.
(True/False)
4.9/5 (36)
Pierre's Motorized Pirogues and Mudboats is setting up an acceptance sampling plan for the special air cleaners he manufactures for his boats.His specifications,and the resulting plan,are shown on the POM for Windows output below.In relatively plain English (someone else will translate for Pierre),explain exactly what he will do when performing the acceptance sampling procedure,and what actions he might take based on the results. 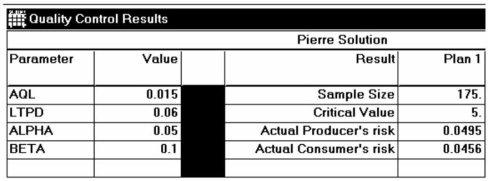
(Essay)
4.9/5 (35)
Filters
- Essay(0)
- Multiple Choice(0)
- Short Answer(0)
- True False(0)
- Matching(0)