Exam 18: Statistical Process Control
Exam 1: Operations and Productivity126 Questions
Exam 2: Operations Strategy in a Global Environment135 Questions
Exam 3: Project Management121 Questions
Exam 4: Forecasting144 Questions
Exam 5: Sustainability in the Supply Chain and Design of Goods and Services137 Questions
Exam 6: Managing Quality129 Questions
Exam 7: Process Strategy and Sustainability131 Questions
Exam 8: Location Strategies139 Questions
Exam 9: Layout Strategies161 Questions
Exam 10: Human Resources,job Design,and Work Measurement192 Questions
Exam 11: Supply-Chain Management145 Questions
Exam 12: Inventory Management168 Questions
Exam 13: Aggregate Planning134 Questions
Exam 14: Material Requirements Planning Mrpand ERP169 Questions
Exam 15: Short-Term Scheduling139 Questions
Exam 16: Jit and Lean Operations137 Questions
Exam 17: Maintenance and Reliability130 Questions
Exam 18: Statistical Process Control156 Questions
Exam 19: Capacity and Constraint Management107 Questions
Exam 20: Supply Chain Management Analytics55 Questions
Exam 21: Decision-Making Tools97 Questions
Exam 22: Linear Programming100 Questions
Exam 23: Transportation Models94 Questions
Exam 24: Waiting-Line Models135 Questions
Exam 25: Learning Curves111 Questions
Exam 26: Simulation92 Questions
Select questions type
A quality analyst wants to construct a sample mean chart for controlling a packaging process.He knows from past experience that when the process is operating as intended,packaging weight is normally distributed with a mean of twenty ounces,and a process standard deviation of two ounces.Each day last week,he randomly selected four packages and weighed each.The data from that activity appears below. 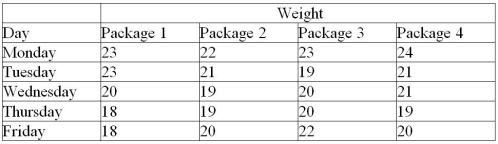 (a)If he sets an upper control limit of 21 and a lower control limit of 19 around the target value of twenty ounces,what is the probability of concluding that this process is out of control when it is actually in control?
(b)With the UCL and LCL of part a,what do you conclude about this process-is it in control?
(a)If he sets an upper control limit of 21 and a lower control limit of 19 around the target value of twenty ounces,what is the probability of concluding that this process is out of control when it is actually in control?
(b)With the UCL and LCL of part a,what do you conclude about this process-is it in control?
(Essay)
4.9/5  (35)
(35)
A quality analyst wants to construct a sample mean chart for controlling a packaging process.He knows from past experience that the process standard deviation is two ounces.Each day last week,he randomly selected four packages and weighed each.The data from that activity appears below.  (a)Calculate all sample means and the mean of all sample means.
(b)Calculate upper and lower control limits that allow for natural variations.
(c)Is this process in control?
(a)Calculate all sample means and the mean of all sample means.
(b)Calculate upper and lower control limits that allow for natural variations.
(c)Is this process in control?
(Essay)
4.8/5 (46)
A process is operating in such a manner that the mean of the process is exactly on the lower specification limit.What must be true about the two measures of capability for this process?
(Essay)
4.9/5 (39)
The mean and standard deviation for a process for which we have a substantial history are μ = 120 and σ = 2.For the x-bar chart,a sample size of 16 will be used.What is the mean of the sampling distribution?
(Multiple Choice)
4.8/5 (39)
A process that is assumed to be in control with limits of 89 +/- 2 had sample averages of the following- 87.1,87,87.2,89,90,89.5,88.5,and 88.Is the process in control?
(Multiple Choice)
4.8/5 (36)
A city police chief decides to do an annual review of the police department by checking the number of monthly complaints.If the total number of complaints in each of the 12 months were 15,18,13,12,16,20,5,10,9,11,8,and 3 and the police chief wants a 90% confidence level,are the complaints in control?
(Essay)
4.8/5 (36)
The acceptable quality level (AQL)is the average level of quality we are willing to accept.
(True/False)
4.9/5 (43)
What are the three possible results (or findings)from the use of control charts?
(Essay)
4.8/5 (38)
The defect rate for a product has historically been about 1.6%.What are the upper and lower control chart limits for a p-chart,if you wish to use a sample size of 100 and 3-sigma limits?
(Essay)
4.8/5 (38)
If  = 23 ounces,σ = 0.4 ounces,and n = 16,the ±3σ control limits will be
(Multiple Choice)
4.9/5 (38)
Jars of pickles are sampled and weighed.Sample measures are plotted on control charts.The ideal weight should be precisely 11 oz.Which type of chart(s)would you recommend?
(Multiple Choice)
5.0/5 (45)
Filters
- Essay(0)
- Multiple Choice(0)
- Short Answer(0)
- True False(0)
- Matching(0)