Exam 18: Statistical Process Control
Exam 1: Operations and Productivity126 Questions
Exam 2: Operations Strategy in a Global Environment135 Questions
Exam 3: Project Management121 Questions
Exam 4: Forecasting144 Questions
Exam 5: Sustainability in the Supply Chain and Design of Goods and Services137 Questions
Exam 6: Managing Quality129 Questions
Exam 7: Process Strategy and Sustainability131 Questions
Exam 8: Location Strategies139 Questions
Exam 9: Layout Strategies161 Questions
Exam 10: Human Resources,job Design,and Work Measurement192 Questions
Exam 11: Supply-Chain Management145 Questions
Exam 12: Inventory Management168 Questions
Exam 13: Aggregate Planning134 Questions
Exam 14: Material Requirements Planning Mrpand ERP169 Questions
Exam 15: Short-Term Scheduling139 Questions
Exam 16: Jit and Lean Operations137 Questions
Exam 17: Maintenance and Reliability130 Questions
Exam 18: Statistical Process Control156 Questions
Exam 19: Capacity and Constraint Management107 Questions
Exam 20: Supply Chain Management Analytics55 Questions
Exam 21: Decision-Making Tools97 Questions
Exam 22: Linear Programming100 Questions
Exam 23: Transportation Models94 Questions
Exam 24: Waiting-Line Models135 Questions
Exam 25: Learning Curves111 Questions
Exam 26: Simulation92 Questions
Select questions type
To set  -chart upper and lower control limits,one must know the process central line,which is the
(Multiple Choice)
4.9/5  (39)
(39)
According to the text,the most common choice of limits for control charts is usually
(Multiple Choice)
4.8/5 (33)
A lot that is accepted by acceptance sampling is certified to be free of defects.
(True/False)
4.8/5 (33)
Larry's boat shop wants to monitor the number of blemishes in the paint of each boat.Construct a 3-sigma c-chart to determine if their paint process is in control using the following data.
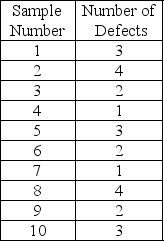
(Essay)
4.9/5 (40)
If the process average is in control,then the process range must also be in control.
(True/False)
4.8/5 (39)
If a sample of items is taken and the mean of the sample is outside the control limits the process is
(Multiple Choice)
5.0/5 (35)
The ________ is a quality control chart used to control the number of defects per unit of output.
(Essay)
4.7/5 (39)
What four elements determine the value of average outgoing quality? Why does this curve rise,peak,and fall?
(Essay)
4.8/5 (35)
A process range chart illustrates the amount of variation within the samples.
(True/False)
4.8/5 (41)
A department chair wants to monitor the percentage of failing students in classes in her department.Each class had an enrollment of 50 students last spring.The number of failing students in the 10 classes offered that term were 1,4,2,0,0,0,0,0,0,and 3,respectively.Compute the control limits for a p-chart at the 95% confidence level.Is the process in control?
(Essay)
4.9/5 (34)
The upper and lower limits for diving ring diameters made by John's Swimming are 40 and 39 cm.John took 11 samples with the following average diameters (39,39.1,39.2,39.3,39.4,39.5 39.6,39.7,39.8,39.9,40).Is the process in control?
(Multiple Choice)
4.8/5 (28)
The usual purpose of an R-chart is to signal whether there has been a
(Multiple Choice)
4.8/5 (37)
If μ = 9 ounces,σ = 0.5 ounces,and n = 9,calculate the 3-sigma control limits.
(Essay)
4.8/5 (33)
The local newspaper receives several complaints per day about typographic errors.Over a seven-day period,the publisher has received calls from readers reporting the following number of errors: 4,3,2,6,7,3,and 9.Based on these data alone,what type of control chart(s)should the publisher use?
(Multiple Choice)
4.8/5 (40)
Cartons of Plaster of Paris are supposed to weigh exactly 32 oz.Inspectors want to develop process control charts.They take ten samples of six boxes each and weigh them.Based on the following data,compute the lower and upper control limits and determine whether the process is in control.
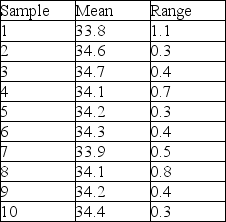
(Essay)
4.8/5 (32)
Filters
- Essay(0)
- Multiple Choice(0)
- Short Answer(0)
- True False(0)
- Matching(0)