Exam 18: Statistical Process Control
Exam 1: Operations and Productivity126 Questions
Exam 2: Operations Strategy in a Global Environment135 Questions
Exam 3: Project Management121 Questions
Exam 4: Forecasting144 Questions
Exam 5: Sustainability in the Supply Chain and Design of Goods and Services137 Questions
Exam 6: Managing Quality129 Questions
Exam 7: Process Strategy and Sustainability131 Questions
Exam 8: Location Strategies139 Questions
Exam 9: Layout Strategies161 Questions
Exam 10: Human Resources,job Design,and Work Measurement192 Questions
Exam 11: Supply-Chain Management145 Questions
Exam 12: Inventory Management168 Questions
Exam 13: Aggregate Planning134 Questions
Exam 14: Material Requirements Planning Mrpand ERP169 Questions
Exam 15: Short-Term Scheduling139 Questions
Exam 16: Jit and Lean Operations137 Questions
Exam 17: Maintenance and Reliability130 Questions
Exam 18: Statistical Process Control156 Questions
Exam 19: Capacity and Constraint Management107 Questions
Exam 20: Supply Chain Management Analytics55 Questions
Exam 21: Decision-Making Tools97 Questions
Exam 22: Linear Programming100 Questions
Exam 23: Transportation Models94 Questions
Exam 24: Waiting-Line Models135 Questions
Exam 25: Learning Curves111 Questions
Exam 26: Simulation92 Questions
Select questions type
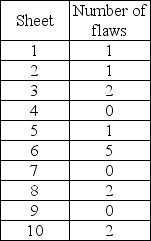
McDaniel Shipyards wants to develop control charts to assess the quality of its steel plate.They take ten sheets of 1" steel plate and compute the number of cosmetic flaws on each roll.Each sheet is 20' by 100'.Based on the following data,develop limits for the control chart,plot the control chart,and determine whether the process is in control.
(Essay)
4.7/5  (32)
(32)
A retail store manager is trying to improve and control the rate at which cashiers sign customers up
for store credit cards.After posting a p-chart of the store's credit card sign-ups the manager takes
new samples of size 50 three weeks later.He finds that each sample of 50 contained 5 credit card
signups on average.Find p-bar and 99.73% control limits.
(Essay)
4.8/5 (24)
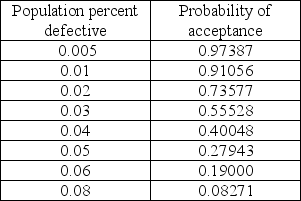
In the table below are selected values for the OC curve associated with the acceptance sampling plan n = 50,c = 1.(Watch out-the points are not evenly spaced. )Assume that upon failed inspection,defective items are replaced.Calculate the AOQ for each data point.(You may assume that the population is much larger than the sample. )Plot the AOQ curve.At approximately what population defective rate is the AOQ at its worst? Explain how this happens.How well does this plan meet the specifications of AQL = 0.0050,α = 0.05;LTPD = 0.05,β = 0.10? Discuss.
(Essay)
4.9/5 (31)
Mean charts and range charts complement one another,one detecting shifts in process average,the other detecting shifts in process dispersion.
(True/False)
4.8/5 (31)
The steeper an OC curve,the better it discriminates between good and bad lots.
(True/False)
4.9/5 (41)
A small,independent amusement park collects data on the number of cars with out-of-state license plates.The sample size is fixed at n = 25 each day.Data from the previous 10 days indicate the following number of out-of-state license plates:
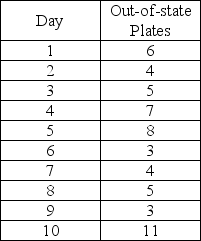 (a)Calculate the overall proportion of "tourists" (cars with out-of-state plates)and the standard deviation of proportions.
(b)Using ± 3σ limits,calculate the LCL and UCL for these data.
(c)Is the process under control? Explain.
(a)Calculate the overall proportion of "tourists" (cars with out-of-state plates)and the standard deviation of proportions.
(b)Using ± 3σ limits,calculate the LCL and UCL for these data.
(c)Is the process under control? Explain.
(Essay)
4.8/5 (45)
The ________ are calculated to show how much allowance should be made for natural variation.
(Essay)
4.9/5 (37)
The statistical definition of Six Sigma allows for 3.4 defects per million.This is achieved by a Cpk index of
(Multiple Choice)
4.9/5 (33)
The ________ is the percent defective in an average lot of goods inspected through acceptance sampling.
(Essay)
4.8/5 (33)
The term ________ is used to describe how well a process makes units within design specifications (or tolerances).
(Essay)
4.8/5 (38)
The statistical process chart used to control the number of defects per unit of output is the
(Multiple Choice)
4.8/5 (44)
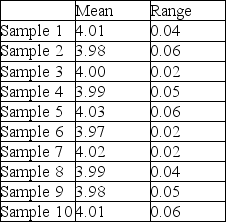
A part that connects two levels should have a distance between the two holes of 4".It has been determined that x-bar and R-charts should be set up to determine if the process is in statistical control.The following ten samples of size four were collected.Calculate the control limits,plot the control charts,and determine if the process is in control.
(Essay)
4.9/5 (42)
The causes of variation in statistical process control are
(Multiple Choice)
4.9/5 (42)
A retail store manager is trying to improve and control the rate at which cashiers sign customers up
for store credit cards.Suppose the manager takes 10 samples,each with 100 observations.P-bar
is found to be .05,and the manager does not want a lower limit below .0064.What z-value would
this imply,and how confident can he be that the true lower limit is greater than or equal to .0064?
(Essay)
4.8/5 (35)
A car mechanic is thinking of guaranteeing customers that an oil change will take no more than 15 minutes with a 99.73% confidence level.He takes a few samples of size 5 and finds the process mean to be 13 minutes with a standard deviation of .2 minutes and average sample range of 1.2 minutes.Find the  ,
,  ,and
,and  values and use them to compute the upper and lower limits for an x-bar chart.Use the upper limit to determine if the mechanic can offer a 15 minute guarantee.Assume the mechanic plots the samples on the x-bar control chart and finds the process is in control,is there anything else the mechanic is missing to ensure the process is in control?
(Essay)
4.9/5 (41)
A c-chart is appropriate to plot the number of flaws in a bolt of fabric.
(True/False)
4.8/5 (36)
Filters
- Essay(0)
- Multiple Choice(0)
- Short Answer(0)
- True False(0)
- Matching(0)