Exam 18: Statistical Process Control
Exam 1: Operations and Productivity126 Questions
Exam 2: Operations Strategy in a Global Environment135 Questions
Exam 3: Project Management121 Questions
Exam 4: Forecasting144 Questions
Exam 5: Sustainability in the Supply Chain and Design of Goods and Services137 Questions
Exam 6: Managing Quality129 Questions
Exam 7: Process Strategy and Sustainability131 Questions
Exam 8: Location Strategies139 Questions
Exam 9: Layout Strategies161 Questions
Exam 10: Human Resources,job Design,and Work Measurement192 Questions
Exam 11: Supply-Chain Management145 Questions
Exam 12: Inventory Management168 Questions
Exam 13: Aggregate Planning134 Questions
Exam 14: Material Requirements Planning Mrpand ERP169 Questions
Exam 15: Short-Term Scheduling139 Questions
Exam 16: Jit and Lean Operations137 Questions
Exam 17: Maintenance and Reliability130 Questions
Exam 18: Statistical Process Control156 Questions
Exam 19: Capacity and Constraint Management107 Questions
Exam 20: Supply Chain Management Analytics55 Questions
Exam 21: Decision-Making Tools97 Questions
Exam 22: Linear Programming100 Questions
Exam 23: Transportation Models94 Questions
Exam 24: Waiting-Line Models135 Questions
Exam 25: Learning Curves111 Questions
Exam 26: Simulation92 Questions
Select questions type
Which of the following is true regarding the relationship between AOQ and the true population percent defective?
(Multiple Choice)
4.9/5  (33)
(33)
Which of the following statements on acceptance sampling is true?
(Multiple Choice)
4.7/5 (40)
The specifications for a manifold gasket that installs between two engine parts calls for a thickness of 2.500 mm ± .020 mm.The standard deviation of the process is estimated to be 0.004 mm.What are the upper and lower specification limits for this product? The process is currently operating at a mean thickness of 2.50 mm.(a)What is the  for this process? (b)The purchaser of these parts requires a capability index of 1.50.Is this process capable? Is this process good enough for the supplier? (c)If the process mean were to drift from its setting of 2.500 mm to a new mean of 2.497,would the process still be good enough for the supplier's needs?
(Essay)
4.8/5 (35)
A(n)________ is a graph that describes how well an acceptance plan discriminates between good and bad lots.
(Essay)
5.0/5 (33)
The specification for a plastic handle calls for a length of 6.0 inches ± .2 inches.The standard deviation of the process is estimated to be 0.05 inches.What are the upper and lower specification limits for this product? The process is known to operate at a mean thickness of 6.1 inches.What is the  and
and  for this process? Is this process capable of producing the desired part?
(Essay)
4.8/5 (35)
The probability of rejecting a good lot is known as consumer's risk.
(True/False)
4.8/5 (39)
An acceptance sampling plan's ability to discriminate between low quality lots and high quality lots is described by
(Multiple Choice)
4.8/5 (41)
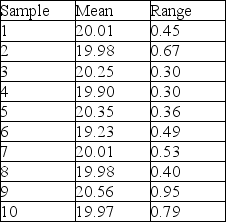
Ten samples of size four were taken from a process,and their weights measured.The sample averages and sample ranges are in the following table.Construct and plot an x-bar and R-chart using this data.Is the process in control?
(Essay)
4.9/5 (38)
Up to three standard deviations above or below the centerline is the amount of variation that statistical process control allows for
(Multiple Choice)
4.8/5 (33)
An acceptance sampling plan is to be designed to meet the organization's targets for product quality and risk levels.Which of the following is true?
(Multiple Choice)
4.8/5 (42)
Averages of small samples,not individual measurements,are generally used in statistical process control.
(True/False)
4.8/5 (38)
Filters
- Essay(0)
- Multiple Choice(0)
- Short Answer(0)
- True False(0)
- Matching(0)