Exam 18: Statistical Process Control
Exam 1: Operations and Productivity126 Questions
Exam 2: Operations Strategy in a Global Environment135 Questions
Exam 3: Project Management121 Questions
Exam 4: Forecasting144 Questions
Exam 5: Sustainability in the Supply Chain and Design of Goods and Services137 Questions
Exam 6: Managing Quality129 Questions
Exam 7: Process Strategy and Sustainability131 Questions
Exam 8: Location Strategies139 Questions
Exam 9: Layout Strategies161 Questions
Exam 10: Human Resources,job Design,and Work Measurement192 Questions
Exam 11: Supply-Chain Management145 Questions
Exam 12: Inventory Management168 Questions
Exam 13: Aggregate Planning134 Questions
Exam 14: Material Requirements Planning Mrpand ERP169 Questions
Exam 15: Short-Term Scheduling139 Questions
Exam 16: Jit and Lean Operations137 Questions
Exam 17: Maintenance and Reliability130 Questions
Exam 18: Statistical Process Control156 Questions
Exam 19: Capacity and Constraint Management107 Questions
Exam 20: Supply Chain Management Analytics55 Questions
Exam 21: Decision-Making Tools97 Questions
Exam 22: Linear Programming100 Questions
Exam 23: Transportation Models94 Questions
Exam 24: Waiting-Line Models135 Questions
Exam 25: Learning Curves111 Questions
Exam 26: Simulation92 Questions
Select questions type
In most acceptance sampling plans,when a lot is rejected,the entire lot is inspected and all defective items are replaced.When using this technique the AOQ
(Multiple Choice)
4.8/5  (48)
(48)
A bank's manager has videotaped 20 different teller transactions to observe the number of mistakes being made.Ten transactions had no mistakes,five had one mistake and five had two mistakes.Compute proper control limits at the 90% confidence level.
(Essay)
4.7/5 (31)
Repeated sampling of a certain process shows the average of all sample ranges to be 1.0 cm.The sample size has been constant at n = 5.What are the 3-sigma control limits for this R-chart?
(Essay)
4.7/5 (31)
Control charts for variables are based on data that come from
(Multiple Choice)
4.7/5 (33)
Examine the Statistical Process Control outputs below.Answer the following questions.
a.What is the sample size?
b.What is the number of samples?
c.What is the mean of sample 8;what is the range of sample 10?
d.Is this process in control? Explain-a simple Yes or No is insufficient.
e.What additional steps should the quality assurance team take? 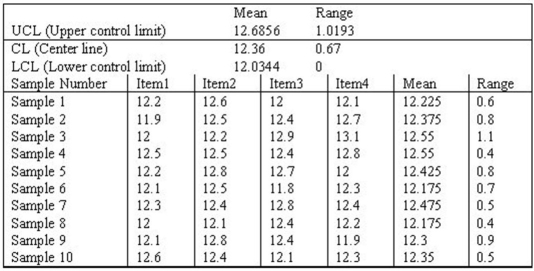
(Essay)
4.9/5 (40)
What is the difference between the process capability ratio Cp and the process capability index Cpk?
(Essay)
4.9/5 (48)
Briefly explain what the Central Limit Theorem has to do with control charts.
(Essay)
4.8/5 (39)
For an x-bar chart where the standard deviation is known,the Upper Control Limit
(Multiple Choice)
4.7/5 (37)
Mistakes stemming from workers' inadequate training represent an assignable cause of variation.
(True/False)
4.9/5 (37)
The specifications for a manifold gasket that installs between two engine parts calls for a thickness of 2.500 mm ± .020 mm.The standard deviation of the process is estimated to be 0.004 mm.What are the upper and lower specification limits for this product? The process is currently operating at a mean thickness of 2.50 mm.(a)What is the Cp for this process? (b)About what percent of all units of this liner will meet specifications? Does this meet the technical definition of Six Sigma?
(Essay)
4.9/5 (44)
An x-bar control chart was examined and no data points fell outside of the limits.Can this process be considered in control?
(Multiple Choice)
4.9/5 (49)
If a process has only natural variations,________ % of the time the sample averages will fall inside the (or)control limits.
(Essay)
4.9/5 (29)
The purpose of process control is to detect when natural causes of variation are present.
(True/False)
4.7/5 (40)
Pierre's Motorized Pirogues and Mudboats is setting up an acceptance sampling plan for the special air cleaners he manufactures for his boats.His specifications,and the resulting plan,are shown on the POM for Windows output below.Pierre is a bit confused.He mistakenly thinks that acceptance sampling will reject all bad lots and accept all good lots.Explain why this will not happen. 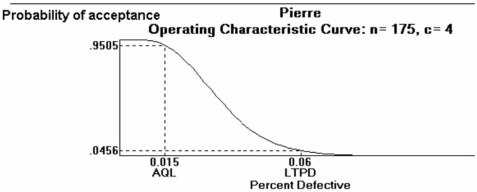
(Essay)
4.7/5 (32)
An operator trainee is attempting to monitor a filling process that has an overall average of 705 cc.The average range is 17 cc.If you use a sample size of 6,what are the upper and lower control limits for the x-bar and R chart?
(Essay)
4.9/5 (29)
At your first job out of college you have been assigned to the production of bottled 20 oz.soda.
The process has upper and lower limits of 20.5 and 19.5 oz,respectively,with a mean of 19.8 oz
and standard deviation of .3 oz.Your manager has requested the process produce no more than 3.4
defects per 1 million bottles produced.Calculate  and then determine if the process is capable
or if you should be looking for assignable variation.
and then determine if the process is capable
or if you should be looking for assignable variation.
(Essay)
4.9/5 (36)
Which of the following statements about acceptance sampling is true?
(Multiple Choice)
4.8/5 (34)
Filters
- Essay(0)
- Multiple Choice(0)
- Short Answer(0)
- True False(0)
- Matching(0)