Exam 4: Using the Derivative
Exam 1: A Library of Functions110 Questions
Exam 2: Key Concept: the Derivative92 Questions
Exam 3: Short-Cuts to Differentiation175 Questions
Exam 4: Using the Derivative108 Questions
Exam 5: Key Concept- the Definite Integral62 Questions
Exam 6: Constructing Antiderivatives90 Questions
Exam 7: Integration179 Questions
Exam 8: Using the Definite Integral104 Questions
Exam 9: Sequences and Series70 Questions
Exam 10: Approximating Functions Using Series71 Questions
Exam 11: Differential Equations135 Questions
Exam 12: Functions of Several Variables93 Questions
Exam 13: A Fundamental Tool- Vectors107 Questions
Exam 14: Differentiating Functions of Several Variables129 Questions
Exam 15: Optimization- Local and Global Extrema77 Questions
Exam 16: Integrating Functions of Several Variables76 Questions
Exam 17: Parameterization and Vector Fields86 Questions
Exam 18: Line Integrals78 Questions
Exam 19: Flux Integrals and Divergence52 Questions
Exam 20: The Curl and Stokes Theorem84 Questions
Exam 21: Parameters, Coordinates, Integrals23 Questions
Select questions type
Determine the equation of the tangent line at x=0 and the value of f(x)at x=1.5 given for all values of a
(Multiple Choice)
4.8/5  (36)
(36)
Sketch a graph of a function whose at x=-1, < 0 when x< -1, < 0 when x> -1,
(Short Answer)
4.8/5 (29)
A normal distribution in statistics is modeled by the function determine where the maximum value of the function would occur.
(Multiple Choice)
4.8/5 (37)
The cost C(q)(in dollars)of producing a quantity q of a certain product is shown in the graph below.The average cost is given by .Graphically, a(q)is the slope of the line between which two points? 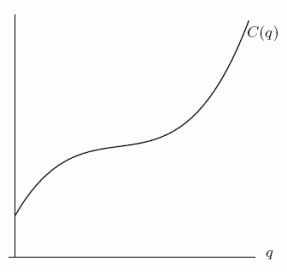
(Multiple Choice)
4.9/5 (32)
Below is the graph of the derivative of a function f, i.e., it is a graph of y = f '(x).Is f increasing or decreasing on the interval ? 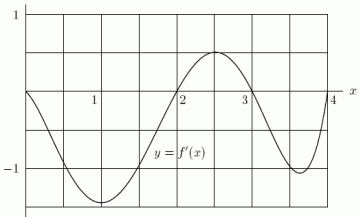
(Short Answer)
4.9/5 (25)
Consider the one-parameter family of functions given by for .What are the effects on the graph as the value of A is decreased?
(Multiple Choice)
5.0/5 (27)
Below is the graph of the rate r at which people arrive for lunch at Cafeteria Charlotte.Checkers start at 12:00 noon and can pass people through at a constant rate of 5 people/minute.Let f(t)be the length of the line (i.e.the number of people)at time t.Suppose that at 11:50 there are already 150 people lined up.Using the graph together with this information, is f concave up or down on the interval 11:55 < t < 12:07? 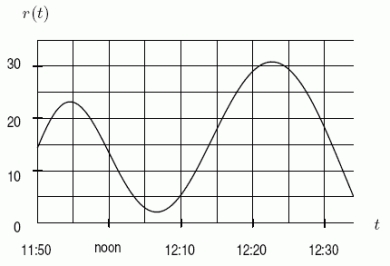
(Short Answer)
4.8/5 (37)
Filters
- Essay(0)
- Multiple Choice(0)
- Short Answer(0)
- True False(0)
- Matching(0)