Exam 14: Excel Lesson 8: Working With Charts
Exam 1: Access Lesson 1: Microsoft Access Basics46 Questions
Exam 2: Access Lesson 2: Creating a Database46 Questions
Exam 3: Access Lesson 3: Creating Queries46 Questions
Exam 4: Access Lesson 4: Creating and Modifying Forms46 Questions
Exam 5: Access Lesson 5: Creating and Modifying Reports46 Questions
Exam 6: Access Lesson 6: Integrating Access46 Questions
Exam 7: Excel Lesson 1: Microsoft Excel Basics46 Questions
Exam 8: Excel Lesson 2: Changing the Appearance of a Worksheet46 Questions
Exam 9: Excel Lesson 3: Organizing the Worksheet46 Questions
Exam 10: Excel Lesson 4: Entering Worksheet Formulas46 Questions
Exam 11: Excel Lesson 5: Using Functions46 Questions
Exam 12: Excel Lesson 6: Enhancing a Worksheet46 Questions
Exam 13: Excel Lesson 7: Working With Multiple Worksheets and Workbooks46 Questions
Exam 14: Excel Lesson 8: Working With Charts46 Questions
Exam 15: Microsoft Office 2010 Basics and the Internet92 Questions
Exam 16: Outlook Lesson 1: Outlook Basics and E-Mail46 Questions
Exam 17: Outlook Lesson 2: Calendar46 Questions
Exam 18: Outlook Lesson 3: Working With Other Outlook Tools46 Questions
Exam 19: Powerpoint Lesson 1: Microsoft Powerpoint Basics46 Questions
Exam 20: Powerpoint Lesson 2: Creating Enhancing Powerpoint Presentations46 Questions
Exam 21: Powerpoint Lesson 3: Working With Visual Elements46 Questions
Exam 22: Powerpoint Lesson 4: Expanding on Powerpoint Basics46 Questions
Exam 23: Publisher Lesson 1: Microsoft Publisher Basics46 Questions
Exam 24: Publisher Lesson 2: Enhancing Publisher Documents46 Questions
Exam 25: Introduction Lesson 1: Microsoft Windows 7 Basics46 Questions
Exam 26: Word Lesson 1: Microsoft Word Basics46 Questions
Exam 27: Word Lesson 2: Basic Editing46 Questions
Exam 28: Word Lesson 3: Helpful Word Features46 Questions
Exam 29: Word Lesson 4: Formatting Text46 Questions
Exam 30: Word Lesson 5: Formatting Paragraphs and Documents46 Questions
Exam 31: Word Lesson 6: Working With Graphics46 Questions
Exam 32: Word Lesson 7: Working With Documents46 Questions
Exam 33: Word Lesson 8: Increasing Efficiency Using Word46 Questions
Select questions type
Case EX 8-2 Paco wants to change some of the elements in his chart, including the fill and border color. What type of dialog box does Paco need to access to make these changes?
Free
(Multiple Choice)
4.8/5  (36)
(36)
Correct Answer: Verified
A
What is the difference between a data marker and a data label? Please describe a situation where you would use both at the same time.
Free
(Essay)
4.9/5 (36)
Correct Answer:Verified
- Data marker: A symbol (such as a bar, line, dot, slice, and so forth) that represents a single data point or value from the corresponding worksheet cell.
- Data label: Text or numbers that provide additional information about a data marker, such as the value from the worksheet cell. Situation (Answers will vary): I would use both data markers and data labels in a situation where exact numbers were important. For example, sales figures at a sales meeting or results from clinical drug trials on a new over-the-counter medicine.
You can change a chart type or subtype at any time. On the Design tab, under Chart Tools on the Ribbon, in the ____ group, click the Change Chart Type button.
Free
(Multiple Choice)
4.8/5 (37)
Correct Answer:Verified
A
A(n) ____________________ is a group of related information in a column or row of a worksheet that is plotted on the chart.
(Short Answer)
4.7/5 (38)
FIGURE EX 8-1 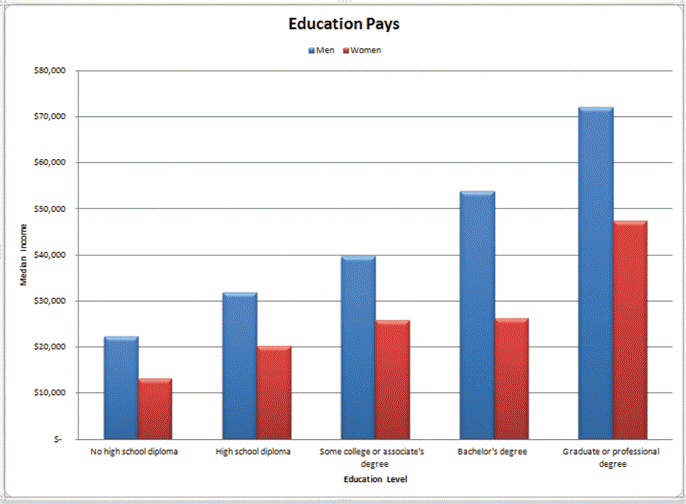 In Figure EX 8-1 above, under Education Pays, the red and blue boxes labeled Men and Women is the ____.
(Multiple Choice)
4.9/5 (32)
A bar chart, sometimes called an XY chart, shows the relationship between two categories of data.
(True/False)
4.9/5 (30)
Axes are lines that establish a relationship between data in a chart; most charts have a horizontal x-axis and a vertical y-axis.
(True/False)
4.7/5 (27)
A pie chart is similar to the column chart, but columns are replaced by points connected by a line.
(True/False)
4.9/5 (38)
You can rename a chart sheet like any other worksheet. Right-click its sheet tab, and then click ____ on the shortcut menu.
(Multiple Choice)
4.8/5 (32)
You can quickly choose a layout and styles for a selected chart from the Ribbon. Click the ____ tab under Chart Tools on the Ribbon. In the Chart Layouts group, click the chart layout you want to use.
(Multiple Choice)
4.9/5 (38)
The chart element called ____ is a grid that displays the data plotted in the chart.
(Multiple Choice)
4.9/5 (35)
The Chart Tools appear on the Ribbon with three contextual tabs that do NOT include ____.
(Multiple Choice)
4.9/5 (26)
Case EX 8-1 Candace wants to create a chart sheet similar to the one shown above. Candace wants to move an embedded chart into a chart sheet. To do this, she would click the Chart Tools Design tab on the Ribbon. Then, in the ____ group, click the Move Chart button.
(Multiple Choice)
4.9/5 (36)
You can show a variety of data markers on sparklines, including the high and low points, negative point, first and last points, and all data points. These options are available in the ____________________ group.
(Short Answer)
4.8/5 (38)
You switch between a chart sheet and a worksheet by clicking the appropriate ____.
(Multiple Choice)
4.8/5 (32)
FIGURE EX 8-1  In Figure EX 8-1 above, the phrase Median Income is the ____.
(Multiple Choice)
4.7/5 (31)
Case EX 8-2 Paco wants to change some of the elements in his chart, including the fill and border color. On a separate chart that he is working on, Paco needs to access the Format dialog box for the chart legend. First, he selects the chart he wants to edit. Then, on the ____ tab under Chart Tools on the Ribbon, in the Current Selection group, he clicks the Format Selection button.
(Multiple Choice)
4.9/5 (36)
A chart sheet does not have worksheet cells and cannot contain data or formulas.
(True/False)
4.7/5 (32)
You can pull one or more slices away from the pie to distinguish them, creating what is called a(n) ____________________ pie chart.
(Short Answer)
4.9/5 (42)
Filters
- Essay(0)
- Multiple Choice(0)
- Short Answer(0)
- True False(0)
- Matching(0)