Exam 9: Large-Sample Tests of Hypotheses
Exam 1: Describing Data With Graphs94 Questions
Exam 2: Describing Data With Numerical Measures186 Questions
Exam 3: Describing Bivariate Data35 Questions
Exam 4: Probability and Probability Distributions136 Questions
Exam 5: Several Useful Discrete Distributions129 Questions
Exam 6: The Normal Probability Distribution196 Questions
Exam 7: Sampling Distributions162 Questions
Exam 8: Large-Sample Estimation173 Questions
Exam 9: Large-Sample Tests of Hypotheses210 Questions
Exam 10: Inference From Small Samples261 Questions
Exam 11: The Analysis of Variance156 Questions
Exam 12: Linear Regression and Correlation165 Questions
Exam 13: Multiple Regression Analysis178 Questions
Exam 14: Analysis of Categorical Data136 Questions
Exam 15: Nonparametric Statistics198 Questions
Select questions type
When the necessary conditions are met, a lower tailed test is being conducted for the difference between two population proportions. If the value of the test statistic is -2.43, then the null hypothesis cannot be rejected at  = 0.025.
(True/False)
4.8/5  (37)
(37)
When the necessary conditions are met, a two-tailed test is being conducted to test the difference between two population means, but your statistical software provides only a one-tail area of .036 as part of its output. The p-value for this test will be:
(Multiple Choice)
4.7/5 (40)
In an attempt to compare the starting salaries for college graduates who majored in business and the education, random samples of 50 recent college graduates in each major were selected and the following information was obtained: 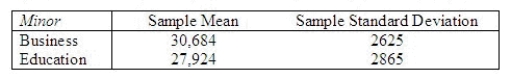 Do the data provide sufficient evidence to indicate a difference in average starting salaries for college graduates who majored in business and education? Test using
  = 0.05.
Test statistic = ______________
Critical Value(s) = ______________
Conclusion: ______________
Interpretation: __________________________________________
= 0.05.
Test statistic = ______________
Critical Value(s) = ______________
Conclusion: ______________
Interpretation: __________________________________________
(Short Answer)
4.8/5 (34)
The alternative hypothesis is a description of the status quo, of conventional wisdom, of a "state of innocence," of what people have long believed to be true.
(True/False)
4.8/5 (37)
A random sample of 150 observations was selected from a binomial population, and 87 successes were observed. Do the data provide sufficient evidence to indicate that the population proportion p is greater than 0.5? Use the critical value approach and the p-value approach, and test at  = 0.05.
Test statistic = ______________
p-value = ______________
Critical Value(s) = ______________
Conclusion: ______________
Interpretation: __________________________________________
= 0.05.
Test statistic = ______________
p-value = ______________
Critical Value(s) = ______________
Conclusion: ______________
Interpretation: __________________________________________
(Short Answer)
4.9/5 (33)
A gas company president for a particular city is interested in the proportion of homes heated by gas. Historically, the proportion of homes heated by gas has been 0.65. A sample of 75 home was selected and it was found that 44 of them heat with gas.
Perform the appropriate test of hypothesis to determine whether the proportion of home heated by gas has changed. Test using  = 0.05.
Test statistic = ______________
Critical Value(s) = ______________
Conclusion: ______________
Interpretation: __________________________________________
Find the p-value for this test.
p-value = ______________
= 0.05.
Test statistic = ______________
Critical Value(s) = ______________
Conclusion: ______________
Interpretation: __________________________________________
Find the p-value for this test.
p-value = ______________
(Essay)
5.0/5 (42)
In testing the null hypothesis  , if
, if  is false, the test could lead to:
(Multiple Choice)
4.8/5 (34)
The Iowa Department of Transportation repaired hundreds of bridges in 1993. To check the average cost to repair a bridge, a random sample of n = 55 bridges was chosen. The mean and standard deviation for the sample are $25,788 and $1,540, respectively. Records from previous years indicate an average bridge repair cost was $25,003. Use the sample data to test that the 1993 mean  is greater than $25,003. Use
  = 0.05.
Test statistic = ______________
Critical Value(s) = ______________
Conclusion: ______________
Interpretation: __________________________________________
= 0.05.
Test statistic = ______________
Critical Value(s) = ______________
Conclusion: ______________
Interpretation: __________________________________________
(Essay)
4.8/5 (35)
A mail-order catalog claims that customers will receive their product within 4 days of ordering. A competitor believes that this claim is an underestimate.
State the appropriate null and alternative hypotheses to be tested by the competitor.
H0: ______________
H1: ______________
Describe the Type I error for this problem.
________________________________________________________
Describe the Type II error for this problem.
________________________________________________________
(Essay)
5.0/5 (32)
The z-test can be used to determine whether two population means are equal.
(True/False)
4.9/5 (43)
A professor of mathematics refutes the claim that the average student spends 4.5 hours studying for the final comprehensive exam. To test the claim, the hypothesis:  ,
,  , should be used.
(True/False)
4.8/5 (40)
If the null hypothesis  is rejected at the 0.05 level of significance, it must be rejected at the 0.01 level.
(True/False)
4.8/5 (35)
The upper limit of the 85% confidence interval for the population proportion p, given that n = 60 and  = 0.20 is 0.274.
(True/False)
4.9/5 (42)
When the necessary conditions are met, a two-tailed test is being conducted for the difference between two population proportions. If the value of the test statistic is -1.35, then the p-value is 0.0885.
(True/False)
4.8/5 (34)
If a decision maker is concerned that the chance of committing a Type II error is large, one way that will help reduce the risk is to increase the significance level.
(True/False)
4.9/5 (30)
With all other factors held constant, increasing the confidence level for a confidence interval estimate for the difference between two population means will result in a wider confidence interval estimate.
(True/False)
4.9/5 (36)
The sampling distribution of  is normal if the sampled populations are normal, and approximately normal if the populations are nonnormal and the sample sizes
  and
and  are large.
(True/False)
4.9/5 (37)
If we reject the null hypothesis  at the 0.01 level of significance, then we must also reject it at the 0.05 level.
(True/False)
4.9/5 (35)
In testing the difference between two population means using two independent samples, the population standard deviations are assumed to be known, and the calculated test statistic equals 2.75. If the test is two-tail and 5% level of significance has been specified, the conclusion should be not to reject the null hypothesis.
(True/False)
4.9/5 (31)
Filters
- Essay(0)
- Multiple Choice(0)
- Short Answer(0)
- True False(0)
- Matching(0)