Exam 9: Large-Sample Tests of Hypotheses
Exam 1: Describing Data With Graphs94 Questions
Exam 2: Describing Data With Numerical Measures186 Questions
Exam 3: Describing Bivariate Data35 Questions
Exam 4: Probability and Probability Distributions136 Questions
Exam 5: Several Useful Discrete Distributions129 Questions
Exam 6: The Normal Probability Distribution196 Questions
Exam 7: Sampling Distributions162 Questions
Exam 8: Large-Sample Estimation173 Questions
Exam 9: Large-Sample Tests of Hypotheses210 Questions
Exam 10: Inference From Small Samples261 Questions
Exam 11: The Analysis of Variance156 Questions
Exam 12: Linear Regression and Correlation165 Questions
Exam 13: Multiple Regression Analysis178 Questions
Exam 14: Analysis of Categorical Data136 Questions
Exam 15: Nonparametric Statistics198 Questions
Select questions type
If a null hypothesis about the population proportion p is rejected at the 0.10 level of significance, it must be rejected at the 0.05 level.
(True/False)
4.8/5  (33)
(33)
If a hypothesis is rejected at the 0.05 level of significance, it:
(Multiple Choice)
4.8/5 (37)
When the necessary conditions are met, a two-tail test is being conducted to test the difference between two population proportions. The two sample proportions are  and
and  , and the standard error of the sampling distribution of
  is 0.04. The calculated value of the test statistic will be:
(Multiple Choice)
4.9/5 (39)
A two-tailed test of the population proportion produces a test statistic z = 1.77. The p-value of the test is 0.4616.
(True/False)
4.7/5 (28)
A Type I error is represented by  , and is the probability of not rejecting a false null hypothesis.
(True/False)
4.8/5 (30)
The daily wages in a particular industry are normally distributed with a mean of $60 and a standard deviation of $13. Suppose a company in this industry employs 50 workers and pays them $57.50 on the average. Based on this sample mean, can these workers be viewed as a random sample from among all workers in the industry?
Find the p-value for the test.
Test statistic = ______________
p-value = ______________
If you planned to conduct your test using  , what would be your test conclusions?
Conclusion: ______________
Interpretation: __________________________________________
, what would be your test conclusions?
Conclusion: ______________
Interpretation: __________________________________________
(Essay)
5.0/5 (34)
The Environmental Protection Agency wanted to compare the proportion of plants in violation of air quality standards for two different industries: steel and utility. Two independent samples of plants were selected and monitored. The following data was recorded: 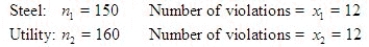 Test at
  = 0.01
Test statistic = ______________
Critical Value(s) = ______________
Conclusion: ______________
Interpretation: __________________________________________
= 0.01
Test statistic = ______________
Critical Value(s) = ______________
Conclusion: ______________
Interpretation: __________________________________________
(Essay)
4.8/5 (34)
A random sample of n = 36 observations from a quantitative population produced a mean  = 2.5 and a standard deviation s = 0.30. Suppose your research objective is to show that the population mean
  exceeds 2.4.
Find the standard error of the mean.
______________
Do the data provide sufficient evidence to indicate that
exceeds 2.4.
Find the standard error of the mean.
______________
Do the data provide sufficient evidence to indicate that  > 2.3. Test at
  = 0.05.
Test statistic = ______________
Critical Value(s) = ______________
Conclusion: ______________
Interpretation: __________________________________________
Calculate the p-value for the test statistic above.
p-value = ______________
Use the p-value to draw a conclusion at the 5% significance level.
Conclusion: ______________
Compare the two conclusions. Are they the same?
______________
Find the critical value of
= 0.05.
Test statistic = ______________
Critical Value(s) = ______________
Conclusion: ______________
Interpretation: __________________________________________
Calculate the p-value for the test statistic above.
p-value = ______________
Use the p-value to draw a conclusion at the 5% significance level.
Conclusion: ______________
Compare the two conclusions. Are they the same?
______________
Find the critical value of  used for rejecting H0.
______________
Calculate
used for rejecting H0.
______________
Calculate  = P(accept H0 when
  = 2.5).
______________
= 2.5).
______________
(Short Answer)
4.8/5 (35)
Assuming that all necessary conditions are met, what needs to be changed in the formula  , so that we can use it to construct a confidence interval estimate for the population proportion p?
(Multiple Choice)
4.9/5 (39)
A group in favor of freezing production of nuclear weapons believes that the proportion of individuals in favor of a nuclear freeze is greater for those who have seen the movie "The Day After" (population 1) than those who have not (population 2). In an attempt to verify this belief, random samples of size 500 are obtained from the populations of interest. Among those who had seen "The Day After", 228 were in favor of a freeze. For those who had not seen the movie, 196 favored a freeze. Test using  = 0.05.
Test statistic = ______________
Critical Value(s) = ______________
Conclusion: ______________
Interpretation: __________________________________________
= 0.05.
Test statistic = ______________
Critical Value(s) = ______________
Conclusion: ______________
Interpretation: __________________________________________
(Essay)
4.8/5 (41)
The significance level in a hypothesis test for the difference between two population means is the same as the probability of committing a Type I error.
(True/False)
4.8/5 (29)
A social worker was interested in determining whether there is a significant difference in the average monthly cost per child for childcare outside the home between state supported facilities and privately owned facilities. Two independent random samples yielded the following information: 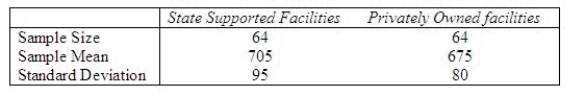 Perform the appropriate test of hypothesis to determine whether there is a significant difference in the average monthly cost per child for childcare between the two types of facilities. Use
  = 0.10.
Test statistic = ______________
Critical Value(s) = ______________
Conclusion: ______________
Interpretation: __________________________________________
Find the p-value for the test above.
p-value = ______________
= 0.10.
Test statistic = ______________
Critical Value(s) = ______________
Conclusion: ______________
Interpretation: __________________________________________
Find the p-value for the test above.
p-value = ______________
(Essay)
4.8/5 (31)
A manufacturing plant has two assembly lines for producing plastic bottles. The plant manager was concerned about whether the proportion of defective bottles differed between the two lines. Two independent random samples were selected and the following summary data computed: 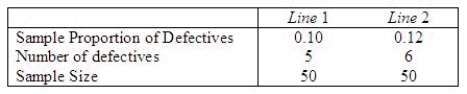 Perform the appropriate test of hypothesis using
  = 0.05.
Test statistic = ______________
Critical Value(s) = ______________
Conclusion: ______________
Interpretation: __________________________________________
= 0.05.
Test statistic = ______________
Critical Value(s) = ______________
Conclusion: ______________
Interpretation: __________________________________________
(Short Answer)
4.7/5 (34)
A computer laboratory manager was in charge of purchasing new battery packs for her lab of laptop computers. She narrowed her choices to two models that were available for her machines. Since the models cost about the same, she was interested in determining whether there was a difference in the average time the battery packs would function before needing to be recharged. She took two independent samples and computed the following summary information: 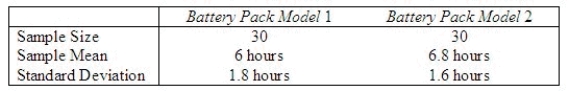 Perform the appropriate test of hypothesis to determine whether there is a significant difference in average functioning time before recharging between the two models of battery packs. Test using
  = 0.10.
Test statistic = ______________
Critical Value(s) = ______________
Conclusion: ______________
Interpretation: __________________________________________
Find the p-value for the test above.
p-value = ______________
= 0.10.
Test statistic = ______________
Critical Value(s) = ______________
Conclusion: ______________
Interpretation: __________________________________________
Find the p-value for the test above.
p-value = ______________
(Essay)
4.7/5 (32)
The lower limit of a confidence interval at the 95% level of confidence for the population proportion if a sample of size 200 had 40 successes is:
(Multiple Choice)
4.8/5 (19)
A p-value is a statistic computed from a simple random sample taken from the population of interest in a hypothesis test and then used for establishing the probable truth or falsity of the null hypothesis.
(True/False)
4.8/5 (31)
If you wish to test whether two populations means are the same, the appropriate null and alternative hypotheses would be:  vs.
vs.  .
.
(True/False)
4.8/5 (38)
Independent samples are those for which the selection process for one is not related to the selection process for the other.
(True/False)
4.8/5 (33)
With all other factors held constant, the chance of committing a Type II error increases if the true population mean  is closer to the hypothesized value
  .
.
(True/False)
4.9/5 (37)
A cable company in Michigan is thinking of offering its service in one of two counties; Mecosta and Newaygo. Allegedly, the proportion of households in either county ready to hook up to the cable is the same, but the company wants to test the claim. Accordingly, it takes a simple random sample in each county. In Mecosta county, 175 of 2900 households say they will join. In Newaygo county, 665 of 800 households say so.
Calculate the pooled estimate of the common proportion p.
______________
Calculate the standard error of  .
______________
Calculate the value of the test statistic.
______________
Calculate the p-value and write your conclusion given that
.
______________
Calculate the value of the test statistic.
______________
Calculate the p-value and write your conclusion given that  = 0.05.
______________
Conclusion: ______________
Interpretation: __________________________________________
Construct 95% confidence interval for the difference in proportions of households in Mecosta and Newaygo counties who are ready to hook up to the cable.
______________
Explain how to use the 95% confidence interval to test the appropriate hypotheses at
= 0.05.
______________
Conclusion: ______________
Interpretation: __________________________________________
Construct 95% confidence interval for the difference in proportions of households in Mecosta and Newaygo counties who are ready to hook up to the cable.
______________
Explain how to use the 95% confidence interval to test the appropriate hypotheses at  = 0.05.
__________________________________________
= 0.05.
__________________________________________
(Essay)
4.8/5 (39)
Filters
- Essay(0)
- Multiple Choice(0)
- Short Answer(0)
- True False(0)
- Matching(0)