Exam 9: Large-Sample Tests of Hypotheses
Exam 1: Describing Data With Graphs94 Questions
Exam 2: Describing Data With Numerical Measures186 Questions
Exam 3: Describing Bivariate Data35 Questions
Exam 4: Probability and Probability Distributions136 Questions
Exam 5: Several Useful Discrete Distributions129 Questions
Exam 6: The Normal Probability Distribution196 Questions
Exam 7: Sampling Distributions162 Questions
Exam 8: Large-Sample Estimation173 Questions
Exam 9: Large-Sample Tests of Hypotheses210 Questions
Exam 10: Inference From Small Samples261 Questions
Exam 11: The Analysis of Variance156 Questions
Exam 12: Linear Regression and Correlation165 Questions
Exam 13: Multiple Regression Analysis178 Questions
Exam 14: Analysis of Categorical Data136 Questions
Exam 15: Nonparametric Statistics198 Questions
Select questions type
In testing a hypothesis about a population proportion p, the z test statistic measures how close the computed sample proportion  has come to the hypothesized population parameter.
(True/False)
4.7/5  (30)
(30)
When testing  vs.
vs.  , an increase in the sample size will result in a decrease in the probability of committing a Type I error.
(True/False)
4.8/5 (34)
When testing 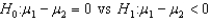 , the observed value of the z-score was found to be -2.15. The p-value for this test would be:
(Multiple Choice)
4.9/5 (42)
When the necessary conditions are met, a two-tailed test is being conducted to test the difference between two population proportions. The two sample proportions are  and
and  , and the standard error of the sampling distribution of
  is 0.0085. The calculated value of the test statistic will be z = 3.41.
(True/False)
4.9/5 (39)
Suppose in testing a hypothesis about a proportion, the p-value is computed to be 0.038. The null hypothesis should be rejected if the chosen level of significance is 0.05.
(True/False)
4.7/5 (32)
In a hypothesis test involving the population proportion, which of the following would be an acceptable formulation?
(Multiple Choice)
4.9/5 (43)
The manufacturer of a particular battery pack for laptop computers claims its battery pack can function for 8 hours, on the average, before having to be recharged. A random sample of 36 battery packs was selected and tested. The mean functioning time before having to be recharged was 7.2 hours with a standard deviation of 1.9 hours. A competitor claims that the manufacturer's claim is too high. Perform the appropriate test of hypothesis to determine whether the competitor is correct. Test using  = 0.05.
Test statistic = ______________
Critical Value(s) = ______________
Conclusion: ______________
Interpretation: __________________________________________
Find the p-value for this test.
p-value = ______________
= 0.05.
Test statistic = ______________
Critical Value(s) = ______________
Conclusion: ______________
Interpretation: __________________________________________
Find the p-value for this test.
p-value = ______________
(Short Answer)
4.8/5 (25)
The erroneous acceptance of a null hypothesis that is in fact false can have consequences such as:
(Multiple Choice)
4.8/5 (32)
Decision makers have most control over Type I error than Type II error.
(True/False)
4.9/5 (33)
A union composed of several thousand employees is preparing to vote on a new contract. A random sample of 500 employees yielded 320 who planned to vote yes. It is believed that the new contract will receive more than 60% yes votes. Can we infer at the 5% significance level that the new contract will receive more than 60% yes votes?
Test statistic = ______________
p-value = ______________
Conclusion: ______________
Interpretation: __________________________________________
(Essay)
4.7/5 (39)
In testing 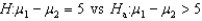 , the test statistic value z is found to be 1.69. What is the p-value of the test?
(Multiple Choice)
4.8/5 (35)
An airline company would like to know if the average number of passengers on a flight in November is less than the average number of passengers on a flight in December. The results of random sampling are printed below. 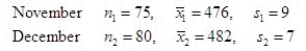 Test the appropriate hypotheses using
  = 0.01.
Test statistic = ______________
Critical Value(s) = ______________
Conclusion: ______________
Interpretation: __________________________________________
= 0.01.
Test statistic = ______________
Critical Value(s) = ______________
Conclusion: ______________
Interpretation: __________________________________________
(Essay)
4.8/5 (37)
When formulating a hypothesis test, which of the following statements is true?
(Multiple Choice)
4.9/5 (42)
A peony plant with red petals was crossed with another plant having streaky petals. A geneticist states that 80% of the offspring resulting from this cross will have red flowers. To test this claim, 120 seeds from this cross were collected and germinated and 84 plants had red petals. Calculate the test statistic and its observed significance level (p-value). Use the p-value to evaluate the statistical significance of the results at the 1% level.
p-value = ______________
Conclusion: ______________
Interpretation: __________________________________________
(Essay)
4.8/5 (27)
The rejection region for testing 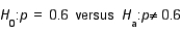 at the 0.05 level of significance is:
(Multiple Choice)
4.9/5 (39)
An alternative hypothesis that holds for deviations from the null hypothesis in one direction only is a one-sided hypothesis.
(True/False)
4.8/5 (40)
In a two-tailed test, if the p-value is less than the probability of committing a Type I error, then:
(Multiple Choice)
4.8/5 (34)
A sample of size 80 is to be used to test the hypotheses H0:  = 29 versus Ha:
  29 where,
  is the true average age of a man when he gets married. What is the appropriate rejection region associated with each of the following significance levels.
  = 0.01
Critical Value(s) = ______________
= 0.01
Critical Value(s) = ______________  = 0.005
Critical Value(s) = ______________
= 0.005
Critical Value(s) = ______________  = 0.05
Critical Value(s) = ______________
= 0.05
Critical Value(s) = ______________  = 0.1
Critical Value(s) = ______________
= 0.1
Critical Value(s) = ______________
(Short Answer)
4.9/5 (33)
Which of the following p-values will lead us to reject the null hypothesis if the level of significance  0.05?
0.05?
(Multiple Choice)
4.9/5 (36)
Filters
- Essay(0)
- Multiple Choice(0)
- Short Answer(0)
- True False(0)
- Matching(0)