Exam 9: Large-Sample Tests of Hypotheses
Exam 1: Describing Data With Graphs94 Questions
Exam 2: Describing Data With Numerical Measures186 Questions
Exam 3: Describing Bivariate Data35 Questions
Exam 4: Probability and Probability Distributions136 Questions
Exam 5: Several Useful Discrete Distributions129 Questions
Exam 6: The Normal Probability Distribution196 Questions
Exam 7: Sampling Distributions162 Questions
Exam 8: Large-Sample Estimation173 Questions
Exam 9: Large-Sample Tests of Hypotheses210 Questions
Exam 10: Inference From Small Samples261 Questions
Exam 11: The Analysis of Variance156 Questions
Exam 12: Linear Regression and Correlation165 Questions
Exam 13: Multiple Regression Analysis178 Questions
Exam 14: Analysis of Categorical Data136 Questions
Exam 15: Nonparametric Statistics198 Questions
Select questions type
A toaster manufacturer receives large shipments of thermal switches from a supplier. A sample from each shipment is selected and tested. The manufacturer is willing to send the shipment back if the proportion of defective switches is more than 5%. Otherwise, the shipment will be kept.
State the appropriate null and alternative hypotheses to be tested by the manufacturer.
H0: ______________
H1: ______________
Describe the Type I error.
________________________________________________________
Describe the Type II error for this problem.
________________________________________________________
From the manufacturer's point of view, which error would be the more serious?
______________
Justify your answer.
________________________________________________________
From the supplier's point of view, which error would be the more serious?
______________
Justify your answer.
________________________________________________________
(Essay)
4.7/5  (35)
(35)
Historically, the average time it takes Jessica to swim the 200 meter butterfly is 148.4 seconds. Jessica would like to know if her average time has changed. She records her time on 50 randomly selected occasions and computes the mean to be 147.8 seconds with a standard deviation of 2.3 seconds.
Perform the appropriate test of hypothesis to determine whether Jessica's average time has changed. Use  = 0.01.
Test statistic = ______________
Critical Value(s) = ______________
Conclusion: ______________
Interpretation: __________________________________________
Compute the power of the test if Jessica's actual mean swimming time is 147.3 seconds.
______________
Interpret the results.
________________________________________________________
= 0.01.
Test statistic = ______________
Critical Value(s) = ______________
Conclusion: ______________
Interpretation: __________________________________________
Compute the power of the test if Jessica's actual mean swimming time is 147.3 seconds.
______________
Interpret the results.
________________________________________________________
(Essay)
4.8/5 (38)
In clinical studies of an allergy drug, 81 of the 900 subjects experienced drowsiness. A competitor claims that 10% of the users of this drug experience drowsiness. Is there enough evidence at the 5% significance level to infer that the competitor is correct?
Test statistic = ______________
p-value = ______________
Conclusion: ______________
Interpretation: __________________________________________
Construct a 95% confidence interval estimate of the population proportion of the users of this allergy drug who experience drowsiness.
______________
Explain how to use this confidence interval to test the hypotheses.
__________________________________________
(Essay)
4.8/5 (32)
Which of the following would be an appropriate alternative hypothesis?
(Multiple Choice)
4.9/5 (37)
If the null hypothesis is actually false, then a hypothesis test may result in a Type II error.
(True/False)
4.9/5 (39)
The proportion of defective computers built by Byte Computer Corporation is 0.15. In an attempt to lower the defective rate, the owner ordered some changes made in the assembly process. After the changes were put into effect, a random sample of 42 computers were tested revealing a total of 4 defective computers. Perform the appropriate test of hypothesis to determine whether the proportion of defective computer has been lowered. Use  = 0.01.
Test statistic = ______________
Critical Value(s) = ______________
Conclusion: ______________
Interpretation: __________________________________________
= 0.01.
Test statistic = ______________
Critical Value(s) = ______________
Conclusion: ______________
Interpretation: __________________________________________
(Essay)
4.9/5 (36)
The use of the standard normal distribution for constructing confidence interval estimate for the population proportion p requires:
(Multiple Choice)
4.8/5 (37)
In testing the difference between two population means using two independent samples, the population standard deviations are assumed to be known and the calculated test statistic equals 2.56. If the test is two-tail and 5% level of significance has been specified, the conclusion should be to:
(Multiple Choice)
4.8/5 (25)
An alternative hypothesis that holds for deviations from the null hypothesis in either direction is a two-sided hypothesis.
(True/False)
4.8/5 (42)
In a two-tailed test for the population mean, the null hypothesis will be rejected at  level of significance if the value of the test statistic z is such that:
(Multiple Choice)
4.9/5 (40)
A set consisting of values that support the alternative hypothesis and lead to rejecting the null hypothesis is called the rejection region.
(True/False)
4.9/5 (29)
A hypothesis that specifies a single value for the unknown parameter is called a point estimate.
(True/False)
4.9/5 (37)
The power of a statistical test, denoted by 1  , is the probability of rejecting a false null hypothesis.
(True/False)
4.9/5 (41)
If a hypothesis test leads to incorrectly accepting the null hypothesis, a Type I error has been committed.
(True/False)
4.9/5 (32)
When we test for differences between the means of two independent populations, we can only use a two-tailed test.
(True/False)
5.0/5 (28)
A university investigation was conducted to determine whether women and men complete medical school in significantly different amounts of time, on the average. Two independent random samples were selected and the following summary information concerning times to completion of medical school computed: 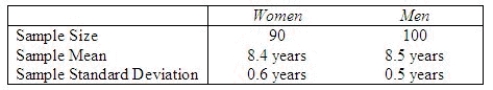 Perform the appropriate test of hypothesis to determine whether there is a significant difference in time to completion of medical school between women and men. Test using
  = 0.05.
Test statistic = ______________
Critical Value(s) = ______________
Conclusion: ______________
Interpretation: __________________________________________
Find the p-value associated with the test above.
p-value = ______________
= 0.05.
Test statistic = ______________
Critical Value(s) = ______________
Conclusion: ______________
Interpretation: __________________________________________
Find the p-value associated with the test above.
p-value = ______________
(Essay)
4.8/5 (37)
A two-tailed hypothesis test of the population mean is used when the alternative hypothesis takes the form  .
.
(True/False)
4.7/5 (44)
To test the theory that the consumption of red meat in the United States has decreased over the last 10 years, a researcher decides to select hospital nutrition records for 400 subjects surveyed 10 years ago and to compare their average amount of beef consumed per year to amounts consumed by an equal number of subjects interviewed this year. The data are given in the table. 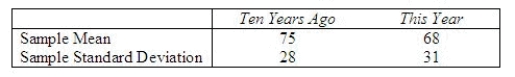 Do the data present sufficient evidence to indicate that per-capita beef consumption has decreased in the last 10 years? Test at the 1% level of significance.
Test statistic = ______________
Critical Value(s) = ______________
Conclusion: ______________
Interpretation: __________________________________________
Find a 99% lower confidence bound for the difference in the average per-capita beef consumption for the two groups.
______________
Does your confidence bound confirm your conclusions above?
______________
Explain.
__________________________________________
What additional information does the confidence bound give you?
__________________________________________
Do the data present sufficient evidence to indicate that per-capita beef consumption has decreased in the last 10 years? Test at the 1% level of significance.
Test statistic = ______________
Critical Value(s) = ______________
Conclusion: ______________
Interpretation: __________________________________________
Find a 99% lower confidence bound for the difference in the average per-capita beef consumption for the two groups.
______________
Does your confidence bound confirm your conclusions above?
______________
Explain.
__________________________________________
What additional information does the confidence bound give you?
__________________________________________
(Essay)
4.8/5 (35)
Filters
- Essay(0)
- Multiple Choice(0)
- Short Answer(0)
- True False(0)
- Matching(0)