Exam 9: Large-Sample Tests of Hypotheses
Exam 1: Describing Data With Graphs94 Questions
Exam 2: Describing Data With Numerical Measures186 Questions
Exam 3: Describing Bivariate Data35 Questions
Exam 4: Probability and Probability Distributions136 Questions
Exam 5: Several Useful Discrete Distributions129 Questions
Exam 6: The Normal Probability Distribution196 Questions
Exam 7: Sampling Distributions162 Questions
Exam 8: Large-Sample Estimation173 Questions
Exam 9: Large-Sample Tests of Hypotheses210 Questions
Exam 10: Inference From Small Samples261 Questions
Exam 11: The Analysis of Variance156 Questions
Exam 12: Linear Regression and Correlation165 Questions
Exam 13: Multiple Regression Analysis178 Questions
Exam 14: Analysis of Categorical Data136 Questions
Exam 15: Nonparametric Statistics198 Questions
Select questions type
In estimating the difference between two population means, if a 90% confidence interval includes zero, then we can be 90% certain that the difference between the two population means is zero.
(True/False)
4.8/5  (27)
(27)
An Internet server claimed that its users averaged 15 hours per week. To determine whether this was an overstatement, a competitor conducted a survey of 150 customers and found that the average time spent online was 13 hours per week with a standard deviation of 6.5 hours. Do the data provide sufficient evidence to indicate that the average hours of use are less than that claimed by the first Internet server? Test at the 1% level of significance.
Test statistic = ______________
p-value = ______________
Conclusion: ______________
Interpretation: __________________________________________
(Essay)
4.8/5 (24)
Which of the following is a required condition for using the normal approximation to the binomial in testing the difference between two population proportions?
(Multiple Choice)
4.8/5 (28)
When testing for differences between the means of two dependent populations, we can use either a one-tailed or two-tailed test.
(True/False)
4.7/5 (38)
Independent random samples of 35 and 50 observations are drawn from two quantitative populations, 1 and 2, respectively. The sample data summary is shown here: 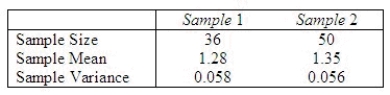 Do the data present sufficient evidence to indicate that the mean for population 1 is smaller than the mean for population 2?
Test statistic = ______________
Critical Value(s) = ______________
Conclusion: ______________
Interpretation: __________________________________________
Find the p-value for the test above.
p-value = ______________
Do the data present sufficient evidence to indicate that the mean for population 1 is smaller than the mean for population 2?
Test statistic = ______________
Critical Value(s) = ______________
Conclusion: ______________
Interpretation: __________________________________________
Find the p-value for the test above.
p-value = ______________
(Essay)
4.8/5 (42)
John Kerry believes that 54% of the voters are supporting him. His opponent, George W. Bush, believes this estimate is too high.
State the appropriate null and alternative hypotheses to be tested by George W. Bush.
H0: ______________
H1: ______________
Describe the Type I error for this problem.
________________________________________________________
Describe the Type II error for this problem.
________________________________________________________
Describe the practical consequences for George W. Bush if he makes a Type I error.
________________________________________________________
Describe the practical consequences for the George W. Bush if he makes a Type II error.
________________________________________________________
(Essay)
4.9/5 (33)
When testing  , the observed value of the z-score was found to be -2.15. Then, the p-value for this test would be
(Multiple Choice)
4.8/5 (37)
In estimating the difference between two population means, the estimate for the standard deviation of the sampling distribution of  is found by taking the square root of the sum of the two sample variances.
(True/False)
4.8/5 (32)
In testing the difference between two population means using two independent samples, the sampling distribution of the sample mean difference  is normal if the sample sizes are both greater than 30.
(True/False)
4.7/5 (34)
In testing  vs.
vs.  random sample of size 200 produced a sample proportion
  Given these results, the p-value of the test is approximately:
(Multiple Choice)
4.7/5 (32)
In testing  vs.
vs.  a random sample of size 200 produced a sample proportion
  Given these results, the null hypothesis should not be rejected at
  = .05.
(True/False)
4.9/5 (32)
In a one-tailed test, the larger the significance level  , the larger the critical value will be.
(True/False)
4.8/5 (36)
In formulating the null and alternative hypothesis, which of the following would be an acceptable null hypothesis?
(Multiple Choice)
4.8/5 (26)
When testing 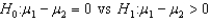 , the observed value of the z-score was found to be -2.15. Then, the p-value for this test would be:
(Multiple Choice)
4.9/5 (38)
In testing  vs.
vs.  at
at  , any p-value greater than .025 will lead to a rejection of the null hypothesis.
(True/False)
4.8/5 (31)
In hypothesis testing, the decision to "accept" the null hypothesis is the same as the decision to "fail to reject" the null hypothesis.
(True/False)
4.9/5 (38)
The p-value for a hypothesis test is set up by the decision maker to minimize the probability of committing a Type I error.
(True/False)
4.9/5 (37)
The campaign manager of John Kerry believes that more than 52% of the registered voters will vote in favor of Kerry. If you wish to test this claim, the appropriate null and alternative hypotheses are  vs.
vs.  .
.
(True/False)
4.8/5 (34)
The p-value or observed significance level measures the strength of the evidence against the alternative hypothesis.
(True/False)
4.7/5 (39)
Filters
- Essay(0)
- Multiple Choice(0)
- Short Answer(0)
- True False(0)
- Matching(0)