Exam 3: Displaying and Summarizing Quantitative Data
Exam 1: Data30 Questions
Exam 2: Displaying and Describing Categorical Data65 Questions
Exam 3: Displaying and Summarizing Quantitative Data93 Questions
Exam 4: Understanding and Comparing Distributions102 Questions
Exam 5: The Standard Deviation As a Ruler and the Normal Model131 Questions
Exam 6: Scatterplots, association, and Correlation74 Questions
Exam 7: Linear Regression57 Questions
Exam 8: Regression Wisdom32 Questions
Exam 9: Re-Expressing Data: Get It Straight51 Questions
Exam 10: Understanding Randomness26 Questions
Exam 11: Sample Surveys50 Questions
Exam 12: Experiments and Observational Surveys87 Questions
Exam 13: From Randomness to Probability64 Questions
Exam 14: Probability Rules90 Questions
Exam 15: Random Variables112 Questions
Exam 16: Probability Models114 Questions
Exam 17: Sampling Distribution Models45 Questions
Exam 18: Confidence Intervals for Proportions56 Questions
Exam 19: Testing Hypotheses About Proportions50 Questions
Exam 20: More About Tests69 Questions
Exam 21: Comparing Two Proportions52 Questions
Exam 22: Inferences About Means106 Questions
Exam 23: Comparing Means43 Questions
Exam 24: Paired Samples and Blocks33 Questions
Exam 25: Comparing Counts78 Questions
Exam 26: Inferences for Regression51 Questions
Exam 27: Analysis of Variance39 Questions
Exam 28: Multifactor Analysis of Variance22 Questions
Exam 29: Multiple Regression22 Questions
Exam 30: Multiple Regression Wisdom21 Questions
Exam 31: Rank-Based Nonparametric Tests29 Questions
Exam 32: The Bootstrap31 Questions
Select questions type
During student-teacher negotiations at a certain high school,teachers seek to change the number of times students are allowed to be tardy,saying that the semester "average" is 8 days of tardiness per student.The students counter that the "average" student is only tardy 4 times per semester.Explain how both sides may be correct,identifying the measure of centre you think each side is using and why the difference might exist.
(Essay)
4.8/5  (32)
(32)
The histogram shows the cost of living,in dollars,in 32 Canadian towns. 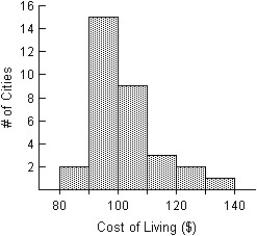
(Multiple Choice)
4.8/5 (34)
The local Tupperware dealers earned the following commissions,in dollars,last month. 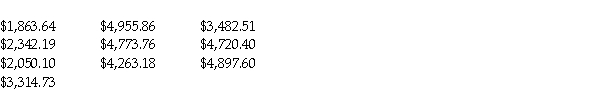 Round your answer to the nearest cent.
(Multiple Choice)
4.9/5 (41)
The test scores of 15 students are listed below.Find the lower quartile (Q1)by hand. 
(Multiple Choice)
4.9/5 (34)
A small company employs a supervisor at $1,300 a week,an inventory manager at $800 a week,7 stock boys at $400 a week,and 5 drivers at $700 a week.Which measure of centre best describes a typical wage at this company,the mean at $600 or the median at $550?
(Multiple Choice)
4.7/5 (34)
The test scores of 19 students are listed below.Find the interquartile range (IQR)by hand. 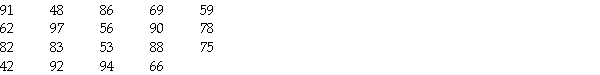
(Multiple Choice)
4.8/5 (34)
In a survey,20 people were asked how many magazines they had purchased during the previous year.The results are shown below.Construct a histogram to represent the data.Use 4 bins with a bin width of 10,and begin with a lower bin limit of -0.5.What is the approximate amount at the centre? 
(Essay)
4.9/5 (39)
The data below give the number of tornadoes that happened each year in a certain county from 1948 through 2004.Create a dotplot of these data. 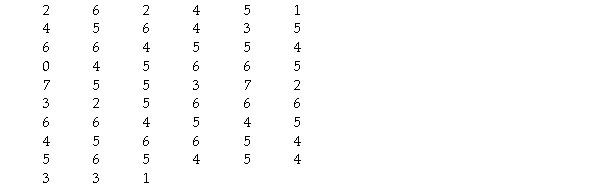
(Essay)
4.8/5 (32)
The weights,in kilograms,of the members of the varsity football team are listed below.Create a stem-and-leaf display of the data.Use split stems by separating each stem into 5 stems. 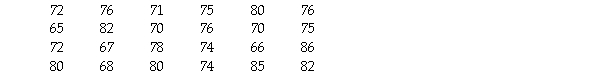
(Essay)
4.8/5 (36)
Here are the commutes (in kilometres)for a group of six employees.Find the standard deviation. 
(Multiple Choice)
4.7/5 (40)
Shown below are the histogram and summary statistics for the reading scores of 29 fifth graders. 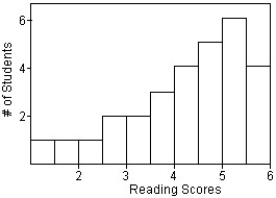
 Which measures of centre and spread would you use for this distribution?
(Multiple Choice)
4.8/5 (42)
Here are the amounts,in dollars,spent by six students at a university book store.  Round your answer to the nearest cent.
(Multiple Choice)
4.8/5 (36)
The histograms display the body fat percentages of 42 female students and 48 male students taking a college health course.For which of the variables depicted in the histograms would you be most satisfied to summarize the centre with a mean? Explain. 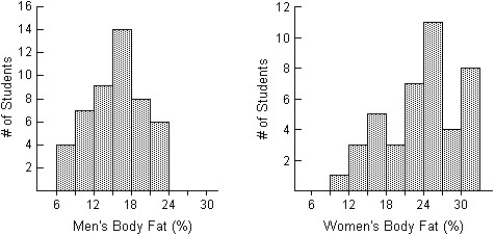
(Multiple Choice)
4.7/5 (41)
Here are the number of baseball games that Dave attended over the last several seasons.
1 15 17 21 30 30 49
(Multiple Choice)
4.8/5 (33)
Here are costs (in dollars)of 12 refrigerators.Find the range. 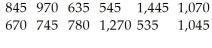
(Multiple Choice)
4.7/5 (40)
In a survey,26 voters were asked their ages.The results are shown below.Construct a histogram to represent the data (with 5 bins beginning with a lower bin limit of 19.5 and a bin width of 10).What is the approximate age at the centre? 

(Essay)
4.8/5 (42)
Here are the average mathematics achievement scores for ninth graders in 32 counties.Find the standard deviation. 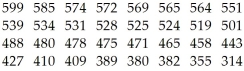
(Multiple Choice)
4.8/5 (33)
The weekly salaries,in dollars,of 16 government workers are listed below.Find the lower quartile (Q1)by hand. 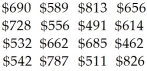
(Multiple Choice)
4.7/5 (42)
Filters
- Essay(0)
- Multiple Choice(0)
- Short Answer(0)
- True False(0)
- Matching(0)