Exam 3: Displaying and Summarizing Quantitative Data
Exam 1: Data30 Questions
Exam 2: Displaying and Describing Categorical Data65 Questions
Exam 3: Displaying and Summarizing Quantitative Data93 Questions
Exam 4: Understanding and Comparing Distributions102 Questions
Exam 5: The Standard Deviation As a Ruler and the Normal Model131 Questions
Exam 6: Scatterplots, association, and Correlation74 Questions
Exam 7: Linear Regression57 Questions
Exam 8: Regression Wisdom32 Questions
Exam 9: Re-Expressing Data: Get It Straight51 Questions
Exam 10: Understanding Randomness26 Questions
Exam 11: Sample Surveys50 Questions
Exam 12: Experiments and Observational Surveys87 Questions
Exam 13: From Randomness to Probability64 Questions
Exam 14: Probability Rules90 Questions
Exam 15: Random Variables112 Questions
Exam 16: Probability Models114 Questions
Exam 17: Sampling Distribution Models45 Questions
Exam 18: Confidence Intervals for Proportions56 Questions
Exam 19: Testing Hypotheses About Proportions50 Questions
Exam 20: More About Tests69 Questions
Exam 21: Comparing Two Proportions52 Questions
Exam 22: Inferences About Means106 Questions
Exam 23: Comparing Means43 Questions
Exam 24: Paired Samples and Blocks33 Questions
Exam 25: Comparing Counts78 Questions
Exam 26: Inferences for Regression51 Questions
Exam 27: Analysis of Variance39 Questions
Exam 28: Multifactor Analysis of Variance22 Questions
Exam 29: Multiple Regression22 Questions
Exam 30: Multiple Regression Wisdom21 Questions
Exam 31: Rank-Based Nonparametric Tests29 Questions
Exam 32: The Bootstrap31 Questions
Select questions type
Three statistics classes (50 students each)took the same test.Shown below are histograms of the scores for the classes.Use the histograms to answer the question. 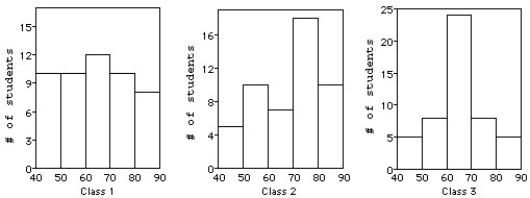 -Which class had the highest median score?
(Multiple Choice)
4.9/5  (36)
(36)
Three statistics classes (50 students each)took the same test.Shown below are histograms of the scores for the classes.Use the histograms to answer the question.
-Which class had the largest standard deviation?
(Multiple Choice)
4.9/5 (43)
In May 2011,17 coffee shops in Toronto charged the following amounts,in dollars,for a large cup of coffee (including tax).The lower stem contains leaves with the digits 0-4 and the upper stem contains leaves with digits 5-9. 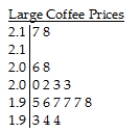 Key:
1.9 | 6 = $1.96
Key:
1.9 | 6 = $1.96
(Multiple Choice)
4.8/5 (41)
The display shows the heights of Grade 12 students at a local high school,collected so that the students could be arranged with shorter ones in front and taller ones in back for a class photograph.In addition to describing the distribution,give a reason to account for the shape of this distribution. 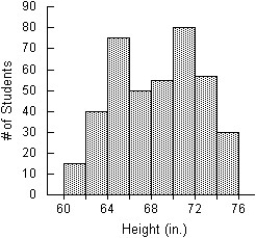
(Multiple Choice)
4.8/5 (42)
The weekly salaries,in dollars,of 16 government workers are listed below.Find the upper quartile (Q3)by hand. 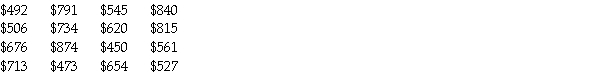
(Multiple Choice)
4.8/5 (38)
The weights,in kilograms,of 18 randomly selected adults are given below.Find the range. 
(Multiple Choice)
4.8/5 (44)
The data below represent the midterm grades for 24 students enrolled in an electrical engineering course.Create a stem-and-leaf display of the data.Use split stems.Let the lower leaf represent digits 0-4 and the upper leaf represent 5-9. 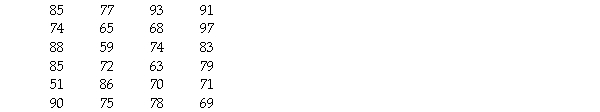
(Essay)
4.7/5 (34)
A small company employs a supervisor at $1,300 a week,an inventory manager at $600 a week,5 stock boys at $300 a week each,and 3 drivers at $500 a week each.
(Multiple Choice)
4.8/5 (34)
The ages of the 21 members of a track and field team are listed below.Find the standard deviation. 
(Multiple Choice)
4.9/5 (34)
The annual incomes,in dollars,of several doctors are listed below. 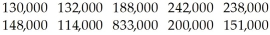
(Multiple Choice)
4.8/5 (35)
Members of the Ontario Field Ornithologists (OFO)observe birds at various locations within the province to see how many different species of bird they can spot.Suppose that 21 members have reported spotting the following number of species in 2010.The lower stem contains leaves with the digits 0-4 and the upper stem contains leaves with digits 5-9. 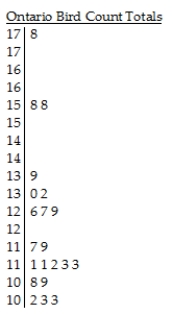 Key:
11 | 7 = 117 birds
Key:
11 | 7 = 117 birds
(Multiple Choice)
4.8/5 (32)
The students in a math class took the Scholastic Aptitude Test.Their math scores are shown below. 
(Multiple Choice)
4.9/5 (42)
Filters
- Essay(0)
- Multiple Choice(0)
- Short Answer(0)
- True False(0)
- Matching(0)