Exam 3: Displaying and Summarizing Quantitative Data
Exam 1: Data30 Questions
Exam 2: Displaying and Describing Categorical Data65 Questions
Exam 3: Displaying and Summarizing Quantitative Data93 Questions
Exam 4: Understanding and Comparing Distributions102 Questions
Exam 5: The Standard Deviation As a Ruler and the Normal Model131 Questions
Exam 6: Scatterplots, association, and Correlation74 Questions
Exam 7: Linear Regression57 Questions
Exam 8: Regression Wisdom32 Questions
Exam 9: Re-Expressing Data: Get It Straight51 Questions
Exam 10: Understanding Randomness26 Questions
Exam 11: Sample Surveys50 Questions
Exam 12: Experiments and Observational Surveys87 Questions
Exam 13: From Randomness to Probability64 Questions
Exam 14: Probability Rules90 Questions
Exam 15: Random Variables112 Questions
Exam 16: Probability Models114 Questions
Exam 17: Sampling Distribution Models45 Questions
Exam 18: Confidence Intervals for Proportions56 Questions
Exam 19: Testing Hypotheses About Proportions50 Questions
Exam 20: More About Tests69 Questions
Exam 21: Comparing Two Proportions52 Questions
Exam 22: Inferences About Means106 Questions
Exam 23: Comparing Means43 Questions
Exam 24: Paired Samples and Blocks33 Questions
Exam 25: Comparing Counts78 Questions
Exam 26: Inferences for Regression51 Questions
Exam 27: Analysis of Variance39 Questions
Exam 28: Multifactor Analysis of Variance22 Questions
Exam 29: Multiple Regression22 Questions
Exam 30: Multiple Regression Wisdom21 Questions
Exam 31: Rank-Based Nonparametric Tests29 Questions
Exam 32: The Bootstrap31 Questions
Select questions type
Jody got a bank statement each month that listed the balance,in dollars,in her checking account.Here are the balances on several statements.  Round your answer to the nearest cent.
(Multiple Choice)
5.0/5  (29)
(29)
The back-to-back dotplot shows the number of fatalities per year caused by tornadoes in a certain state for two periods: 1950-1974 and 1975-1999.Explain how you would summarize the centre and spread of each of the variables depicted in the dotplots. 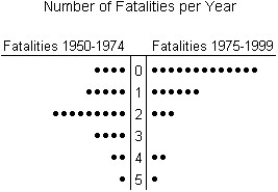
(Multiple Choice)
4.7/5 (36)
The stem-and-leaf diagram shows the ages of 17 people at a playground in London,Ontario. 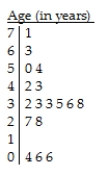 Key:
3 | 3 = 33 years
Key:
3 | 3 = 33 years
(Multiple Choice)
4.7/5 (33)
Three statistics classes (50 students each)took the same test.Shown below are histograms of the scores for the classes.Use the histograms to answer the question. 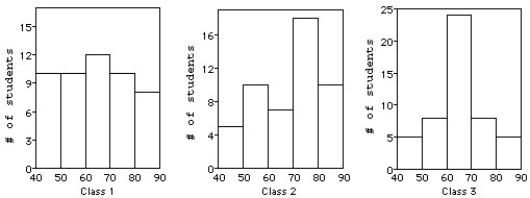 -For which class are the mean and median most different?
(Multiple Choice)
4.8/5 (39)
The stem-and-leaf display shows the results of a math test written by 30 students. 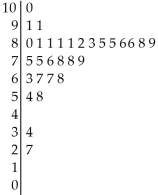
(Multiple Choice)
4.8/5 (36)
The employees at Frank's Furniture earned the following amounts,in dollars,last week.  Round your answer to the nearest cent.
(Multiple Choice)
4.8/5 (34)
A weight-loss company used the following histogram to show the distribution of the number of pounds lost by clients during the year 2005.Comment on the display. 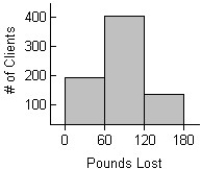
(Essay)
4.8/5 (36)
The precipitation,in millimetres,for August is given for 20 different Canadian cities. 
(Multiple Choice)
4.7/5 (39)
The diastolic blood pressures,in mm Hg,for a sample of patients at a clinic are given.Create a stem-and-leaf display of the data.Use split stems.Let the lower leaf represent digits 0-4 and the upper leaf represent 5-9. 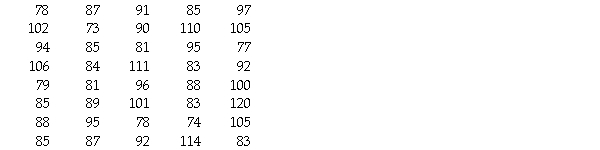
(Essay)
4.9/5 (33)
Heights of a group of male professional athletes,half of whom are gymnasts and half of whom are basketball players.
(Multiple Choice)
4.7/5 (39)
The test scores of 19 students are listed below.Find the upper quartile (Q3)by hand. 
(Multiple Choice)
4.9/5 (31)
Office workers were asked how long it took them to travel to work one morning.Here is the stem-and-leaf display. 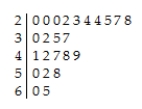 Would you use the median or the mean to describe the centre of this distribution?
(Multiple Choice)
4.9/5 (46)
Number of innings in the baseball games a major league team plays over the course of a season.
(Multiple Choice)
4.8/5 (34)
The histogram shows the lengths of hospital stays (in hours)for pregnant women admitted to hospitals in Ontario who were having contractions upon arrival. 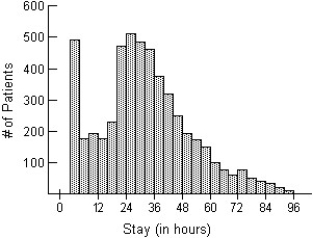
(Multiple Choice)
4.8/5 (38)
The number of cars passing through a Tim Hortons "drive-thru" during each 15-minute period was recorded.The results are shown below. 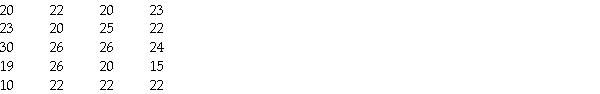
(Multiple Choice)
4.8/5 (36)
In a college health course,65 students participated in a physical fitness assessment.One measure used in the assessment was body fat.The body fat percentages for the 65 students is given below.Create a histogram of the data using bins that are 2% wide. 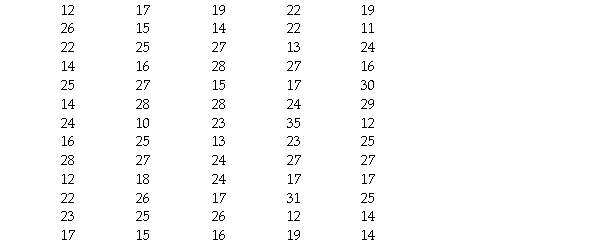
(Essay)
4.9/5 (41)
Last year,nine employees of an electronics company retired.Their ages at retirement,in years,are listed below.  Round your answer to the nearest tenth.
(Multiple Choice)
4.9/5 (32)
Here are the prices for 8 different CD players.Find the standard deviation. 
(Multiple Choice)
4.9/5 (31)
Filters
- Essay(0)
- Multiple Choice(0)
- Short Answer(0)
- True False(0)
- Matching(0)