Exam 3: Displaying and Summarizing Quantitative Data
Exam 1: Data30 Questions
Exam 2: Displaying and Describing Categorical Data65 Questions
Exam 3: Displaying and Summarizing Quantitative Data93 Questions
Exam 4: Understanding and Comparing Distributions102 Questions
Exam 5: The Standard Deviation As a Ruler and the Normal Model131 Questions
Exam 6: Scatterplots, association, and Correlation74 Questions
Exam 7: Linear Regression57 Questions
Exam 8: Regression Wisdom32 Questions
Exam 9: Re-Expressing Data: Get It Straight51 Questions
Exam 10: Understanding Randomness26 Questions
Exam 11: Sample Surveys50 Questions
Exam 12: Experiments and Observational Surveys87 Questions
Exam 13: From Randomness to Probability64 Questions
Exam 14: Probability Rules90 Questions
Exam 15: Random Variables112 Questions
Exam 16: Probability Models114 Questions
Exam 17: Sampling Distribution Models45 Questions
Exam 18: Confidence Intervals for Proportions56 Questions
Exam 19: Testing Hypotheses About Proportions50 Questions
Exam 20: More About Tests69 Questions
Exam 21: Comparing Two Proportions52 Questions
Exam 22: Inferences About Means106 Questions
Exam 23: Comparing Means43 Questions
Exam 24: Paired Samples and Blocks33 Questions
Exam 25: Comparing Counts78 Questions
Exam 26: Inferences for Regression51 Questions
Exam 27: Analysis of Variance39 Questions
Exam 28: Multifactor Analysis of Variance22 Questions
Exam 29: Multiple Regression22 Questions
Exam 30: Multiple Regression Wisdom21 Questions
Exam 31: Rank-Based Nonparametric Tests29 Questions
Exam 32: The Bootstrap31 Questions
Select questions type
The test scores of 19 students are listed below.Find the range. 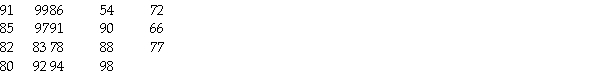
(Multiple Choice)
4.8/5  (41)
(41)
The semester point totals of 16 students are listed below.Find the interquartile range (IQR)by hand. 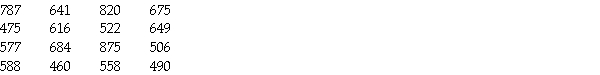
(Multiple Choice)
4.8/5 (36)
Office workers were asked how long it took them to travel to work one morning.Here is the stem-and-leaf display. 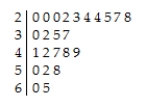 Without actually finding the mean and the median,would you expect the mean to be higher or lower than the median?
(Multiple Choice)
4.9/5 (43)
A university instructor created a website for her Chemistry course.The students in her class were encouraged to use the website as an additional resource for the course.At the end of the semester,the instructor asked each student how many times he or she visited the website and recorded the counts.Based on the histogram below,describe the distribution of website use. 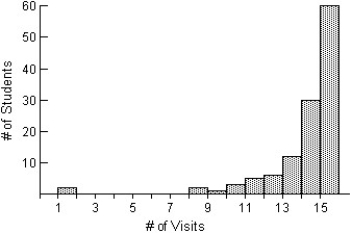
(Multiple Choice)
5.0/5 (42)
A substitute teacher traveled the following distances,in kilometres,to arrive at work. 
(Multiple Choice)
4.7/5 (38)
Here are the grocery bills,in dollars,for six shoppers.  Round your answer to the nearest cent.
(Multiple Choice)
4.7/5 (27)
The mathematics department at a Canadian university collected data for the number of students enrolled in 40 math courses over the course of one year.The following stem-and-leaf display shows the total number of students enrolled in each class. 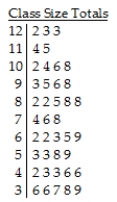 Key:
10 | 6 = 106 students
Key:
10 | 6 = 106 students
(Multiple Choice)
4.9/5 (37)
Three statistics classes (50 students each)took the same test.Shown below are histograms of the scores for the classes.Use the histograms to answer the question. 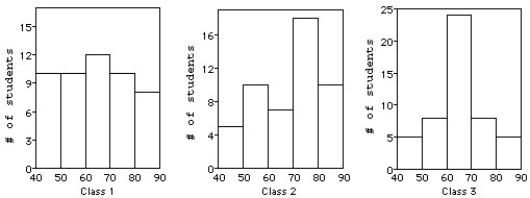 -Which class had the highest mean score?
(Multiple Choice)
4.9/5 (37)
Number of times each face of a fair six-sided die shows in 60 tosses.
(Multiple Choice)
4.8/5 (34)
A dotplot of the number of tornadoes each year in a certain county from 1948 to 2004 is given.Each dot represents a year in which there were that many tornadoes. 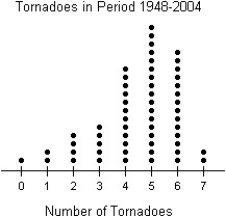
(Multiple Choice)
4.8/5 (27)
The weights (in kilograms)of 27 dogs are listed below.Find the standard deviation. 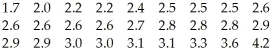
(Multiple Choice)
4.7/5 (37)
The histogram displays the body fat percentages of 65 students taking a college health course.In addition to describing the distribution,give a reason to account for the shape of this distribution. 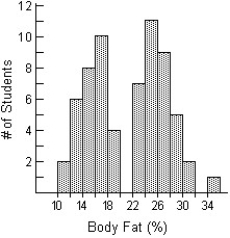
(Multiple Choice)
4.9/5 (34)
Three statistics classes (50 students each)took the same test.Shown below are histograms of the scores for the classes.Use the histograms to answer the question.
-Which class had the smallest standard deviation?
(Multiple Choice)
4.9/5 (37)
A small company employs a supervisor at $1,100 a week,an inventory manager at $700 a week,6 stock boys at $400 a week,and 4 drivers at $600 a week.Which measure of spread,would best describe the payroll,the range,the IQR,or the standard deviation?
(Multiple Choice)
4.9/5 (32)
Students were asked to make a histogram of the number of corn snakes collected in Will County,Illinois from 1985 to 2006.They were given the data in the form of a stem-and-leaf display shown below: 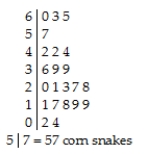 One student submitted the following display:
 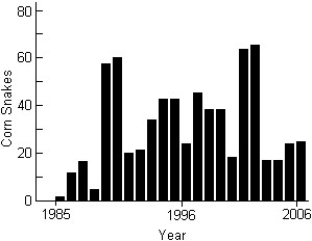 a)Comment on this graph.
b)Create your own histogram of the data.
a)Comment on this graph.
b)Create your own histogram of the data.
(Essay)
4.9/5 (33)
The histograms show the cost of living,in dollars,for 32 U.S.cities.The histogram on the left shows the cost of living for the 32 cities using bins $10 wide,and the histogram on the right displays the same data using bins that are $6 wide.For which of the histograms would you most strenuously insist on using an IQR rather than a standard deviation to summarize spread? Explain. 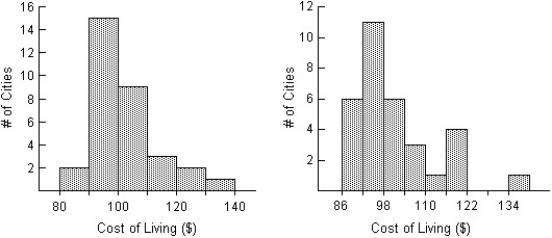
(Multiple Choice)
4.8/5 (43)
A clerk entering salary data into a company spreadsheet accidentally omitted a "0" in the CEO's salary,listing it as $155,000 instead of $1,550,000.Explain how this error will affect these summary statistics for the company payroll: a)measures of centre: median and mean;and b)measures of spread: range,IQR,and standard deviation.
(Short Answer)
4.9/5 (31)
Filters
- Essay(0)
- Multiple Choice(0)
- Short Answer(0)
- True False(0)
- Matching(0)